
Bitget App
Trade smarter
Buy cryptoMarketsTradeFuturesStocksEarnInstitutionAI & More
Examining Worldcoin’s price recovery options after 22% weekly correction

Examining Worldcoin’s price recovery options after 22% weekly correction

CryptoNewsNetCryptoNewsNet2026/06/23 21:45
By:CryptoNewsNet
Back to the list

Examining Worldcoin’s price recovery options after 22% weekly correction

Examining Worldcoin’s price recovery options after 22% weekly correction image 0  ambcrypto.com 29 m
Examining Worldcoin’s price recovery options after 22% weekly correction image 1

The crypto market has suffered a sizeable sell-off in recent hours. Since reaching a high of $65,622 on Monday, June 22, Bitcoin [$BTC] has fallen by 3.55% to $62,466. The altcoin market cap has also shrunk 3.85% since Monday’s high.

Since the final week of May, Worldcoin [$WLD] has seen a short-term uptrend. Last week, the altcoin reached a high of $0.723 on Wednesday, June 17. Since then, it has fallen by 22.17%, and the past 24 hours of trading alone saw $WLD shed 11.5%.

The Open Interest has decreased by 16.05% in 24 hours, according to Coinalyze data. The swift price losses and declining speculative interest underlined the short-term bearish pressure on Worldcoin.

Assessing the hopeful Worldcoin price structure
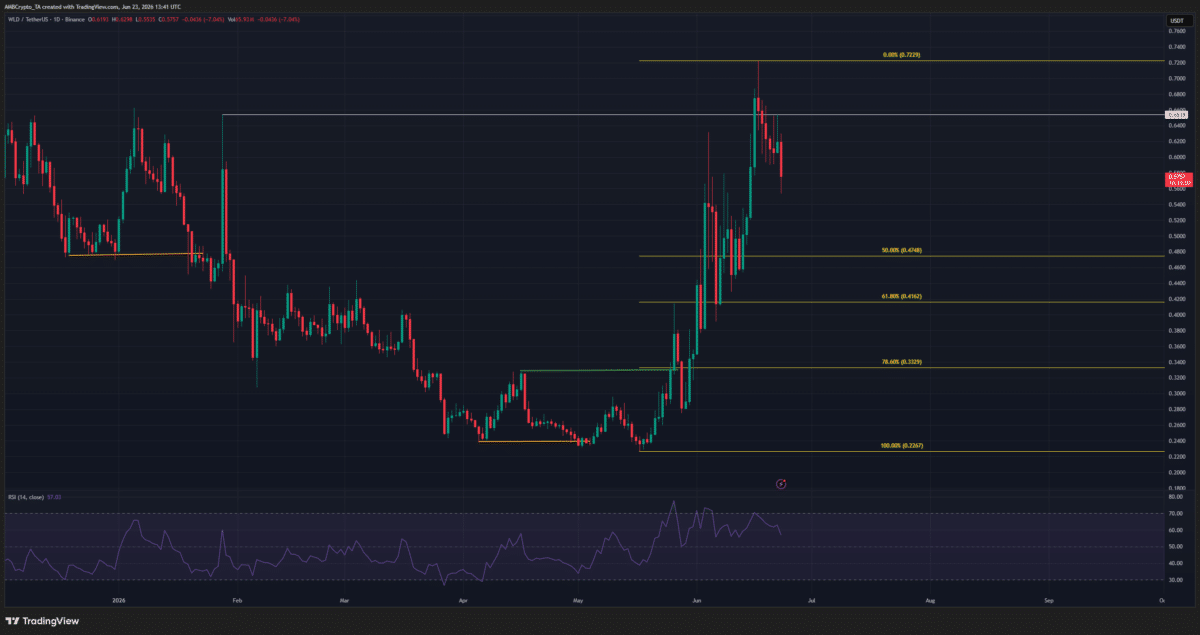
Examining Worldcoin’s price recovery options after 22% weekly correction image 2 Source: $WLD/ $USDT on TradingView

Despite the falling prices in recent days, $WLD has made significant progress over the past month. The token made a bullish internal shift towards the end of May, when its prices surpassed a local high at $0.329 [green]. Since then, $WLD has rallied swiftly and managed to surpass the $0.654 high made in February.

The daily session closed above this high from February marked a bullish swing structure shift on this timeframe. In this context, the losses of the past week were part of a retracement phase. Based on the swing move from $0.2267 to $0.7229, a set of Fibonacci retracement levels [yellow] was plotted.

The $0.4748, $0.4162, and $0.3329 levels are particularly important supports. Worldcoin bulls might be able to bring about a bullish reaction after a retest of one of these levels.

Swing traders and investors must remember that the Bitcoin long-term trend was bearish. A severe $BTC sell-off could spark a deep $WLD retracement in the coming months.

$WLD traders might get another chance to buy
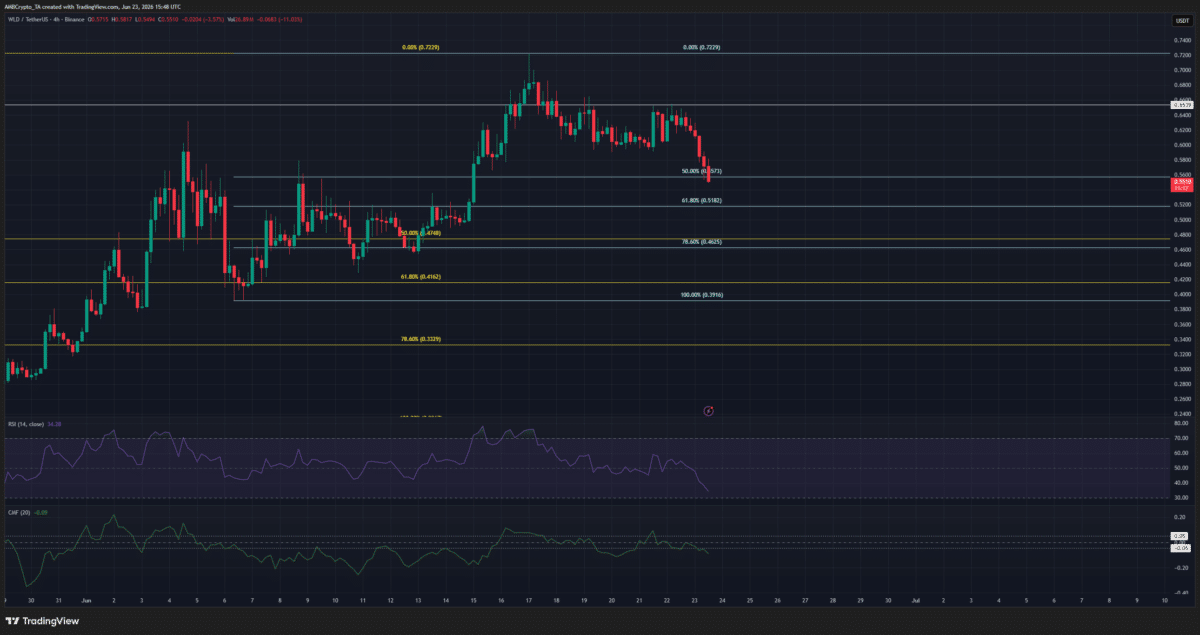
Examining Worldcoin’s price recovery options after 22% weekly correction image 3 Source: $WLD/ $USDT on TradingView

The 4-hour structure was bullish, with the $0.462-$0.518 area being the golden pocket for buyers. A drop below $0.391 would invalidate the bullish H4 structure, and serve as a warning of a deeper retracement toward $0.332.

The technical indicators on this timeframe were leaning bearish. The RSI had dropped to 34, signaling hefty downward momentum recently. The CMF slid below -0.05, showing heightened capital outflows and selling pressure.

Overall, the key $WLD demand zones were clearly visible, and cautious bullishness was warranted. At the same time, a Bitcoin slide below $60k could lead to a deeper reset.

Final Summary

  • The Worldcoin price action was firmly bearish in recent days, and the altcoin has shed 22% in under a week.
  • Despite this correction, there was a chance that $WLD bulls would manage to defend important support levels and keep the upward move going in the coming weeks.
0
0

Disclaimer: The content of this article solely reflects the author's opinion and does not represent the platform in any capacity. This article is not intended to serve as a reference for making investment decisions.

Understand the market, then trade.
Bitget offers one-stop trading for cryptocurrencies, stocks, and gold.
Trade now!

You may also like

VIX surges to highest level since the tariff dispute in April last year; Goldman Sachs Fear Index approaches maximum; US stocks may face another $80 billion sell-off next week

As the U.S. stock market faced a sharp sell-off on Friday, two major Wall Street market risk indicators issued warnings simultaneously.

智通财经•2026/11/20 23:42

Nvidia (NVDA.US) plunges 46% over seven weeks, marking the longest losing streak since the 2008 financial crisis, with its market capitalization evaporating by $2.6 trillion.

Nvidia is experiencing its longest consecutive weekly decline since the 2008 global financial crisis.

智通财经•2026/11/20 23:36

Overnight U.S. Stocks | Stocks, Gold, and Bitcoin Plunge Indiscriminately as VIX Fear Index Surges to 40, Nasdaq Wipes Out Year-to-Date Gains

At the close, the Dow Jones Industrial Average fell 949.73 points, or 1.93%, to 48,147.32 points; the S&P 500 index dropped 265.44 points, or 3.70%, to 6,910.39 points; and the Nasdaq declined 1,261.46 points, or 5.28%, to 22,617.73 points, down 2.7% year-to-date.

智通财经•2026/11/20 23:31

What happened? AI trading crash! Nasdaq drops over 5%, Anthropic IPO nearly breaks on the second day, Nvidia falls over 10%

Investors are not doubting the prospects of AI technology, but are beginning to question whether current valuations have fully priced in future growth. Anthropic's popularity does not prove the investment logic for the entire industry. Since Jensen Huang resigned as CEO, NVIDIA has experienced seven consecutive declines, falling nearly 28% in seven days. After Huang was investigated, news of a SEC accounting investigation added further pressure, causing its market value to evaporate by $2.65 trillion compared to the October peak. AMD closed down more than 10%, plunging for two consecutive days after a short-selling report, and the entire AI industry chain is undergoing widespread sell-off. The return on AI capital expenditure is being questioned, and the unwinding of crowded trades is amplifying the downward trend.

华尔街见闻•2026/11/20 23:26