

- ADA holds near demand, while traders monitor 0.1586 support for signs of a bounce or deeper decline.
- Funding rates remain near neutral despite months of weakness, showing balanced derivatives positioning.
- Resistance between 0.1639 and 0.1651 remains a key barrier before any broader recovery can develop.
ADA Outlook remains centered on a critical support area as Cardano trades near demand. Market structure remains bearish, though derivatives data and price action suggest traders are watching for a possible short-term recovery.
ADA Trades Near Critical Demand Support
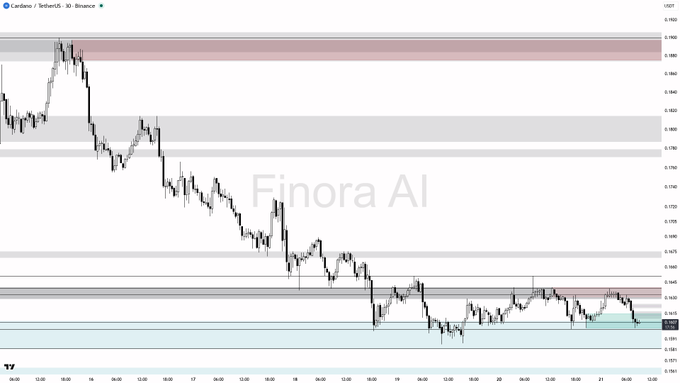
Finora AI’s focused on Cardano’s 30-minute chart. The analysis described a bearish trend approaching a major demand zone. Price continued forming lower highs and lower lows throughout recent sessions.
According to the chart, support around 0.1586 remains highly important. Buyers have repeatedly defended this region during recent trading activity. That defense has prevented a broader breakdown for now.
 Source:
The analysis noted a possible liquidity sweep beneath support. Such a move could trigger stop losses before a rebound. Traders often watch these patterns during weak market conditions.
A quick reclaim of 0.1600 could improve short-term sentiment. That scenario may create room for a move higher. Resistance levels remain the primary obstacle for buyers.
Resistance Levels Continue To Limit Recovery Attempts
Cardano as of the time of writing, traded at $0.1609 during the latest 24-hour period. The session included sharp intraday swings and repeated reversals. Neither buyers nor sellers achieved a decisive breakout.
Early strength pushed price toward the $0.1630 region. However, sellers quickly emerged and erased those gains. The rejection reinforced existing downside pressure.
Price later entered a consolidation range between key levels. Buyers defended support near $0.1600 throughout several tests. Meanwhile, resistance continued capping upward momentum.
Finora AI identified the 0.1639-0.1651 area closely. That zone previously acted as support before turning into resistance. Bearish reactions there could favor renewed downside pressure.
Funding Data Shows Balanced Market Positioning
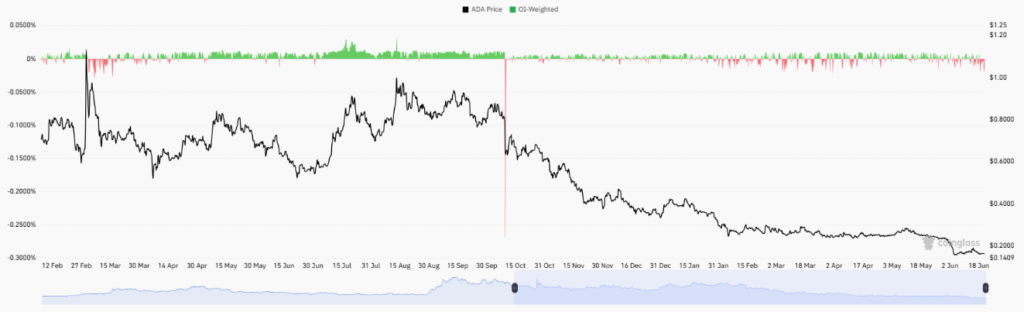
Derivative data offered another perspective on Cardano. The OI-weighted funding rate remained near neutral for months. That behavior contrasted with the prolonged price decline.
 Source:
From February through September, positive funding dominated trading activity. Long positions generally paid shorts during that period. Traders maintained expectations for higher prices despite volatility.
The market shifted after October as prices moved lower. Cardano gradually declined toward the $0.14 region over time. Funding rates, however, avoided deeply negative readings.
That pattern suggests limited conviction among aggressive short sellers. Market participants appear cautious despite the bearish trend. A clean reclaim above 0.1639 would improve the technical outlook.
For now, ADA Outlook remains tied to support near 0.1586. A successful defense could encourage another recovery attempt. A confirmed breakdown would place lower support levels into focus.


