Bitget App
Trade smarter
Buy cryptoMarketsTradeFuturesStocksEarnInstitutionAI & More
Forget the price charts. Here's how bitcoin and S&P 500 look like when adjusted for the money printer

Forget the price charts. Here's how bitcoin and S&P 500 look like when adjusted for the money printer

CryptoNewsNetCryptoNewsNet2026/06/17 06:57
By:CryptoNewsNet
Back to the list

Forget the price charts. Here's how bitcoin and S&P 500 look like when adjusted for the money printer

Forget the price charts. Here's how bitcoin and S&P 500 look like when adjusted for the money printer image 0  coindesk.com 4 m
Forget the price charts. Here's how bitcoin and S&P 500 look like when adjusted for the money printer image 1

If you're only looking at the dollar price of your portfolio, you may be missing part of the picture, which is significantly shaped by money supply growth.

To the casual observer, the markets look like business as usual. While bitcoin has nearly halved to $66,000 since its $126,000 peak in October of last year, the decline could be dismissed as just another brutal, quadrennial crypto bear market. Meanwhile, the S&P 500 continues to hover near record highs.

But beneath the surface, a more interesting signal emerges when both prices are adjusted for the U.S. M2 money supply. M2 is the Federal Reserve's estimate of liquid assets, including cash on hand, money deposited in checking and savings accounts, and other short-term saving vehicles such as money market funds and certificates of deposit.

Monetary exhaustion?

Some observers see bitcoin as a high-beta barometer for dollar liquidity, and the $BTC/M2 ratio, bitcoin's price adjusted for money supply growth, is now flashing a warning. The ratio, after a sharp climb from 2023 through 2025, appears to have formed what technical analysts call a head-and-shoulders pattern, typically read as a bearish signal.
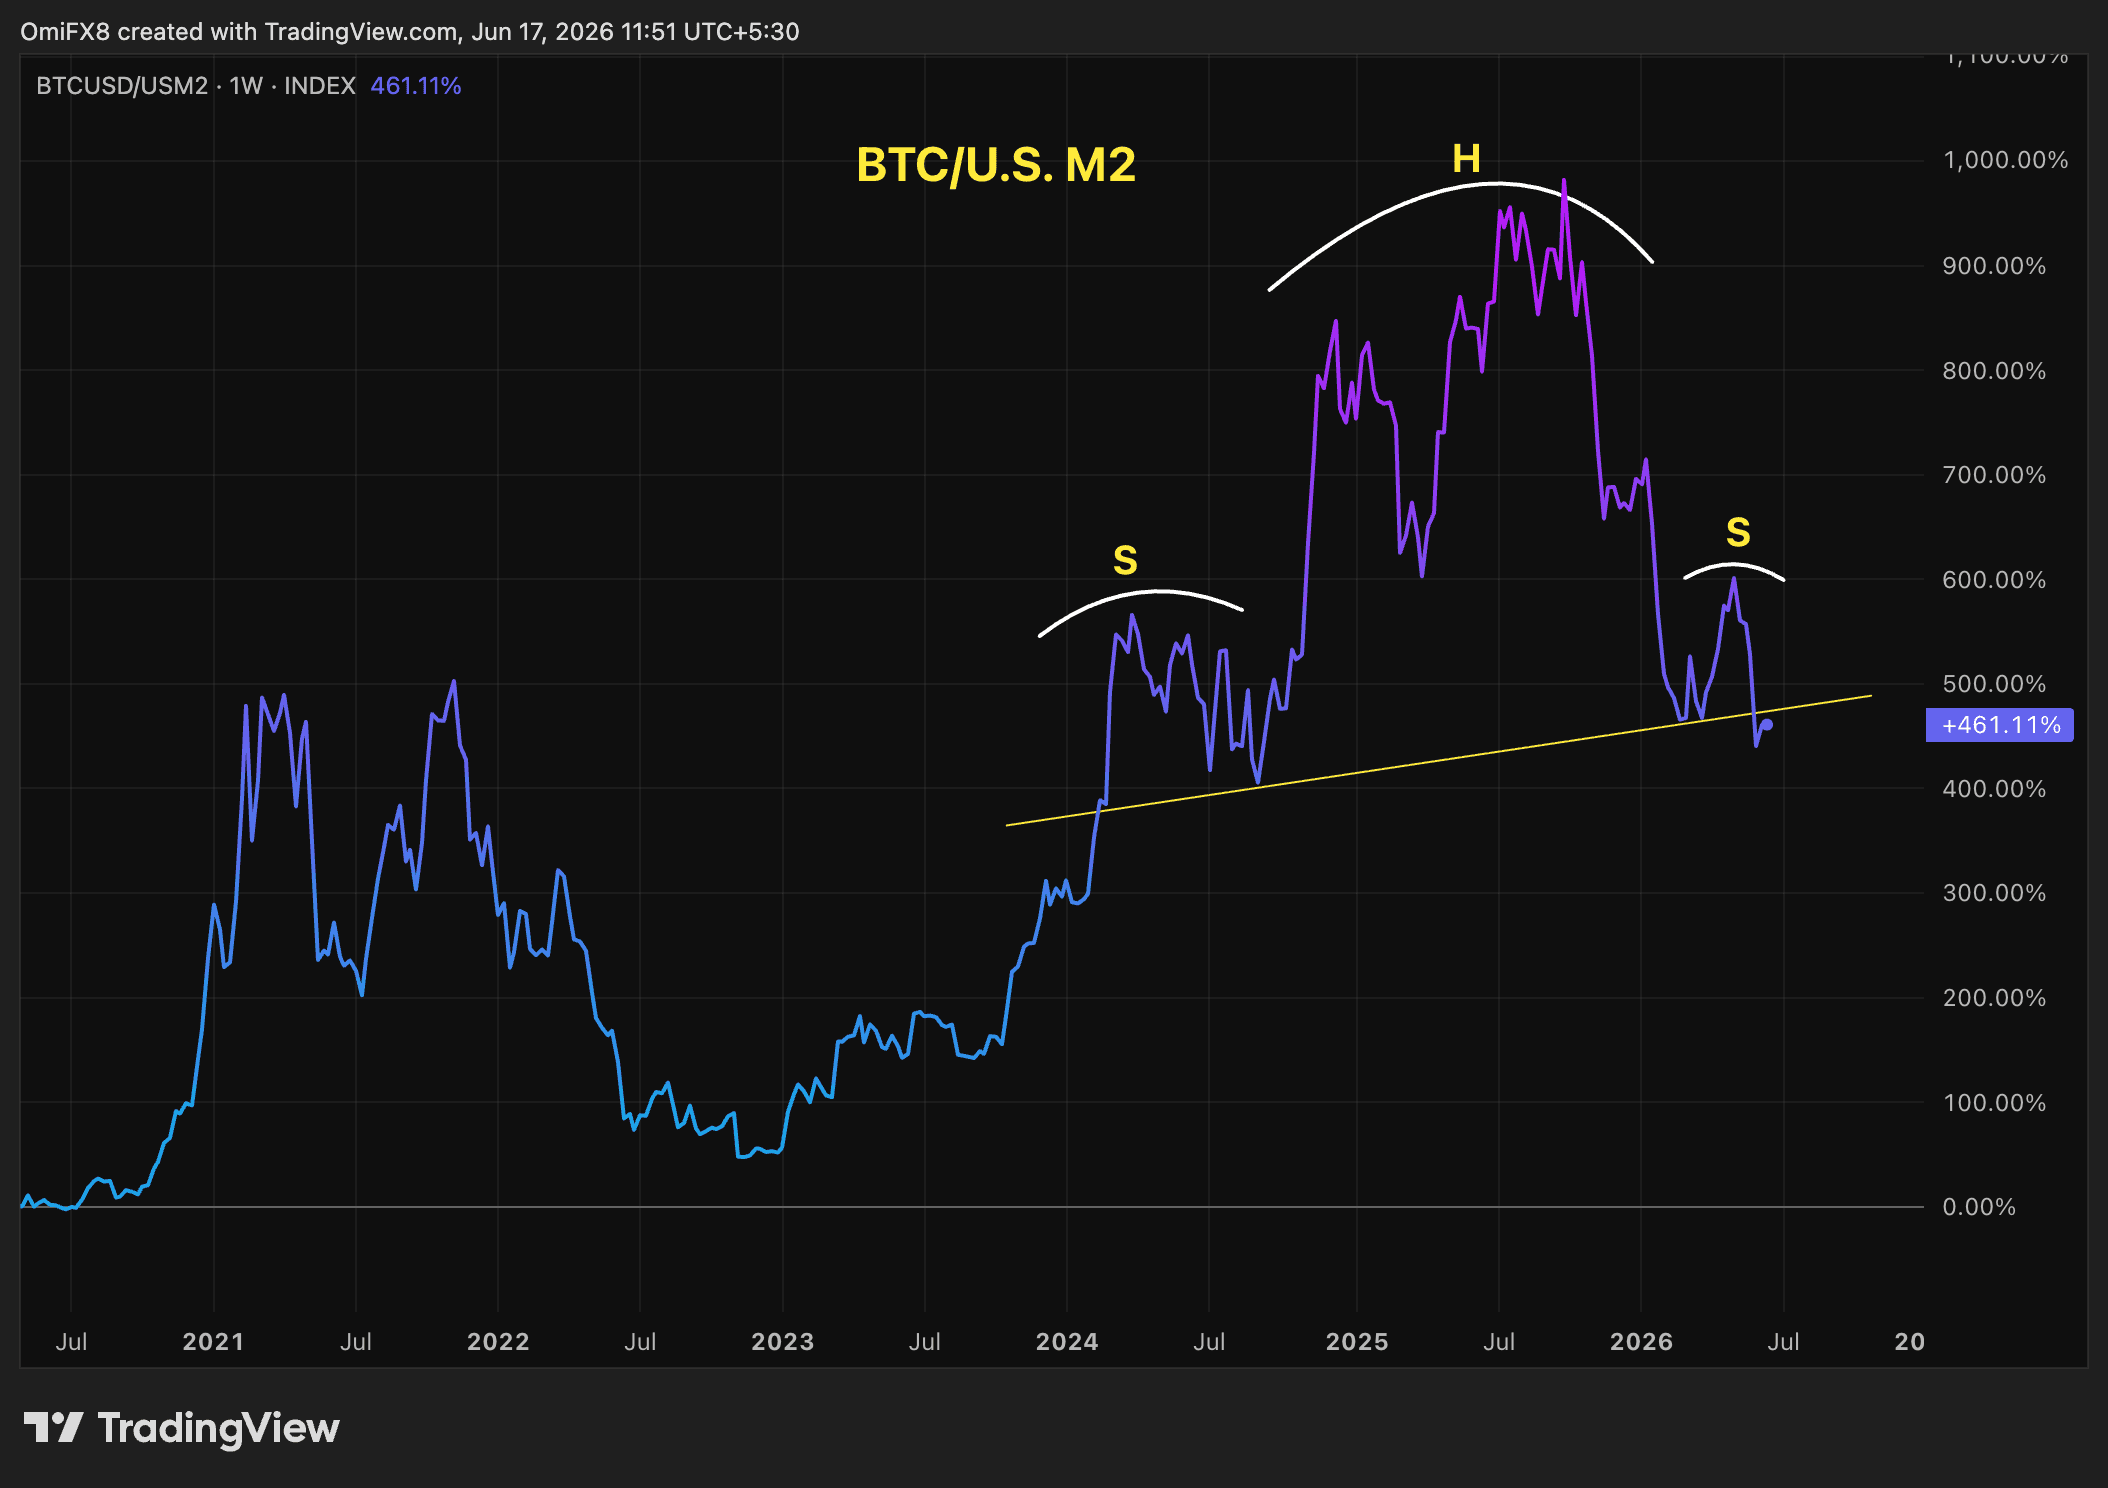
Forget the price charts. Here's how bitcoin and S&P 500 look like when adjusted for the money printer image 2 $BTC's price-to-U.S. M2 money supply. (TradingView)

If the pattern holds, it would suggest bitcoin's exponential edge over money supply growth — the dynamic that let it outrun debasement so convincingly in prior cycles — is fading. Bitcoin's ability to outpace the flood of new dollars may be approaching diminishing returns, at least for now.

That matters beyond crypto. Bitcoin has at times been viewed as a leading indicator for broader risk appetite, and the S&P 500's own money-supply-adjusted valuation tells a story that looks very different from its nominal price.
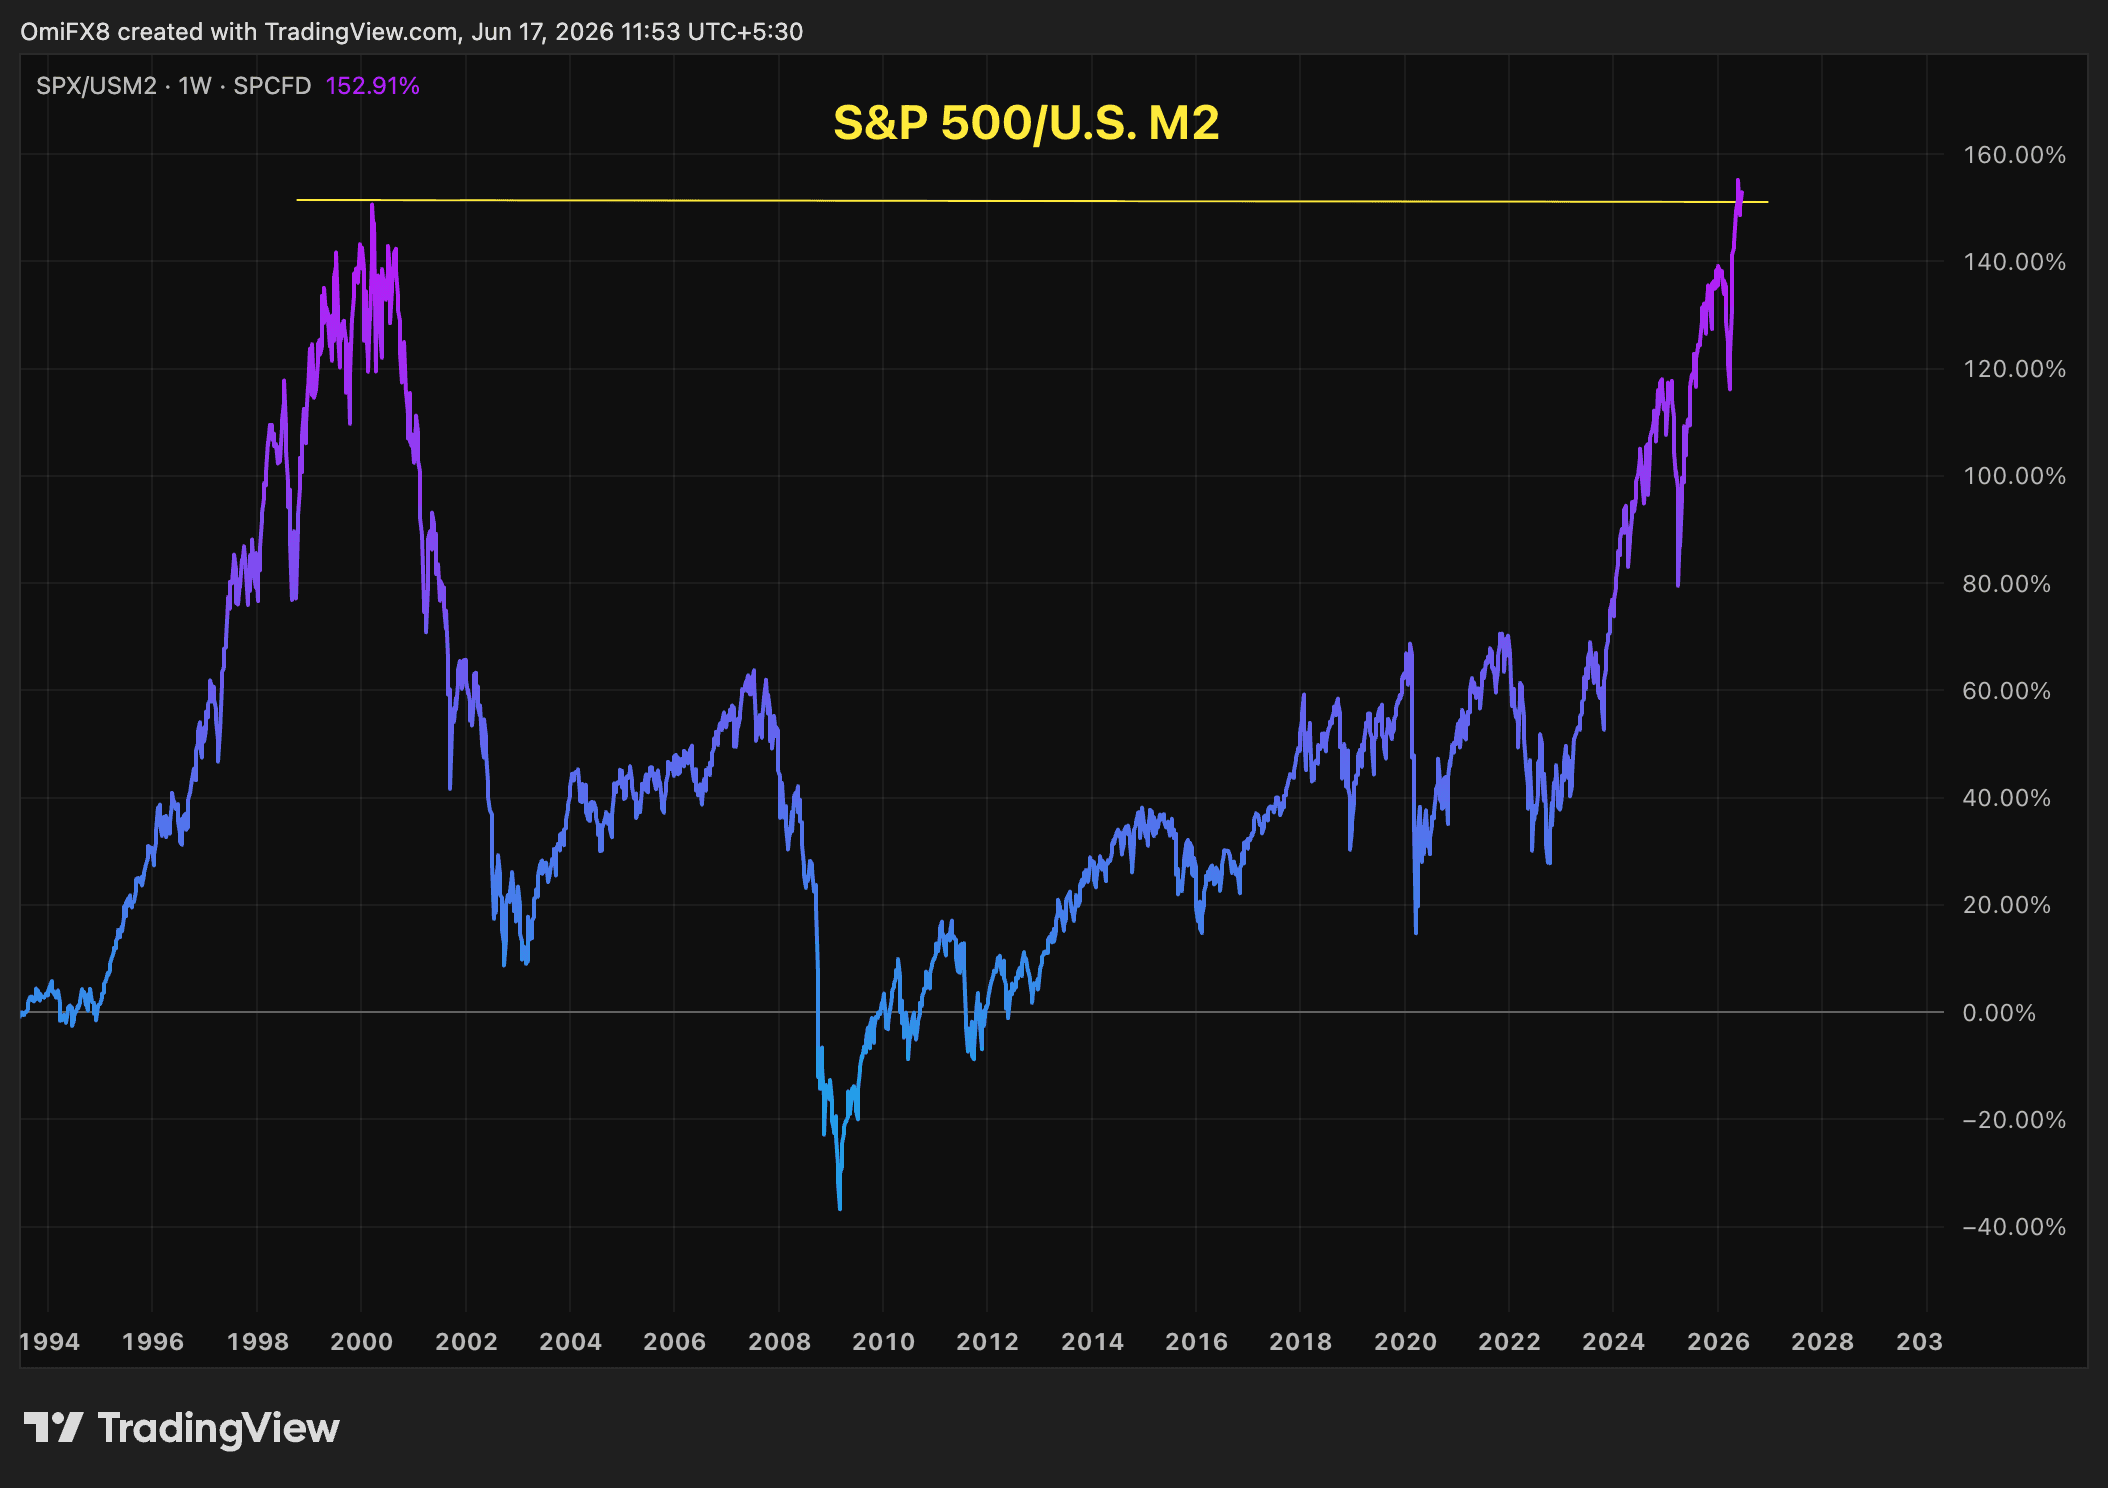
Forget the price charts. Here's how bitcoin and S&P 500 look like when adjusted for the money printer image 3 S&P 500-to-U.S. M2 (TradingView)

The index currently hovers near a record high of 7,511 points, well above its 2000 peak of around 1,500 points in nominal terms. But adjusted for two decades of M2 growth, the S&P 500 has only recently reclaimed that 2000-era high. That doesn't necessarily mean equities are as overextended as they were at the height of the dot-com bubble, as corporate earnings today are generally considered stronger and more durable compared to 1999-2000.

But on this specific money-supply-adjusted basis, it has taken a quarter-century of money-supply expansion just to get the index's monetary-adjusted valuation back to where it stood at the height of the dot-com bubble. In other words, every new dollar added to the system has had to work harder for a relatively smaller marginal gain in valuation.

The takeaway

Bitcoin has at times moved ahead of broader macro turns. If its monetary valuation is genuinely losing ground to M2 growth, it could be an early warning that the S&P 500's nominal gains rest on a thinner foundation than they appear.


0
0

Disclaimer: The content of this article solely reflects the author's opinion and does not represent the platform in any capacity. This article is not intended to serve as a reference for making investment decisions.

Understand the market, then trade.
Bitget offers one-stop trading for cryptocurrencies, stocks, and gold.
Trade now!

You may also like

The script at the end of 2018: The Federal Reserve continued to raise interest rates, US stocks plunged 20% from the September highs, forcing the Federal Reserve to "pivot" in January.

Goldman Sachs' head of trading believes the current US stock market is repeating the scenario of late 2018, with monetary tightening and equity market pressure. The Goldman Sachs Financial Conditions Index has tightened by about 8 points in two weeks, reaching the highest level in a year. The selloff has broadened from tech stocks to defensive sectors. Gold and equities are declining simultaneously, possibly indicating investors are selling assets to raise cash, making gold a key indicator for observing liquidity stress.

华尔街见闻•2026/11/21 05:31
The script at the end of 2018: The Federal Reserve continued to raise interest rates, US stocks plunged 20% from the September highs, forcing the Federal Reserve to "pivot" in January.

Goldman Sachs Trader “Revisits the 2018 Playbook”: Still Clearly Remembers “On December 24th, Clients Asked Why the Market Dropped So Much—And I Had No Idea”

Brian Garrett pointed out that the current adjustment in the US stock market is similar to the sharp decline in Q4 2018: the S&P 500 has already experienced 42% of the corresponding drop, and the VIX is approaching its peak just before Christmas. If history repeats itself, the bottom of this cycle may appear in January next year. However, the credit market and Federal Reserve policy have yet to provide clear signals of a bottom.

华尔街见闻•2026/11/21 03:51

Anthropic (ANT.US) nearly “broke issue price,” but Claude knocks on the doors of “the highest peak in mathematics”! 17 million lines of Lean code used to write a candidate proof for the Riemann Hypothesis

On November 20th, Eastern Time, on its second day of trading, Anthropic's intraday price dropped to a low of $83.05, just 5 cents above the offering price of $83, and finally closed at $88.91, a decline of 8.50%. On the same day, the company's mathematician Levant Alperg announced on his personal website that he and Claude had found a candidate proof for the Riemann hypothesis, which has puzzled the mathematics community for 167 years, and released about 17 million lines of Lean formalized code.

智通财经•2026/11/21 03:21
Anthropic (ANT.US) nearly “broke issue price,” but Claude knocks on the doors of “the highest peak in mathematics”! 17 million lines of Lean code used to write a candidate proof for the Riemann Hypothesis

As US stocks plummet, the parent company of GTA 6 rises against the market! First-day sales hit a record $3.79 billion; Wall Street shifts focus to next-generation GTA Online.

According to Rentrak data, the global box office of "Grand Theft Auto VI" has also surpassed that of "Avengers: Endgame," the highest-grossing film of all time, which has a global box office of approximately $2.94 billion.

智通财经•2026/11/21 02:41
As US stocks plummet, the parent company of GTA 6 rises against the market! First-day sales hit a record $3.79 billion; Wall Street shifts focus to next-generation GTA Online.
