
Analyst Spots XRP Signal That Preceded Every Major Rally Since 2017

By:Newsbtc
Bitget offers one-stop trading for cryptocurrencies, stocks, and gold. Trade now!
A welcome pack worth 6200 USDT for new users! Sign up now!
XRP may be heading toward a significant price recovery if a rare technical signal repeating across multiple market cycles holds true again.

Based on analysis, a long-term ascending channel that has guided the token’s price since 2017 currently has XRP sitting just above its lower support boundary — a position that, combined with a deeply depressed momentum reading, has analysts watching closely.
A Pattern Decades In The Making
The monthly relative strength index for XRP has fallen to 42.7, according to analysis published by market commentator Celal Kucuker.
var rnd = window.rnd || Math.floor(Math.random()*10e6); var pid607465 = window.pid607465 || rnd; var plc607465 = window.plc607465 || 0; var abkw = window.abkw || ''; var absrc = 'https://servedbyadbutler.com/adserve/;ID=172179;size=0x0;setID=607465;type=js;sw='+screen.width+';sh='+screen.height+';spr='+window.devicePixelRatio+';kw='+abkw+';pid='+pid607465+';place='+(plc607465++)+';rnd='+rnd+';click=CLICK_MACRO_PLACEHOLDER'; document.write('
');
if (!window.AdButler){(function(){var s = document.createElement("script"); s.async = true; s.type = "text/javascript";s.src = "https://servedbyadbutler.com/app.js";var n = document.getElementsByTagName("script")[0]; n.parentNode.insertBefore(s, n);}());}
var AdButler = AdButler || {}; AdButler.ads = AdButler.ads || []; var abkw = window.abkw || ""; var plc366606 = window.plc366606 || 0; (function(){ var divs = document.querySelectorAll(".plc366606:not([id])"); var div = divs[divs.length-1]; div.id = "placement_366606_"+plc366606; AdButler.ads.push({handler: function(opt){ AdButler.register(172179, 366606, [728,90], "placement_366606_"+opt.place, opt); }, opt: { place: plc366606++, keywords: abkw, domain: "servedbyadbutler.com", click:"CLICK_MACRO_PLACEHOLDER" }}); })();
That reading places it near the lowest levels recorded in the token’s trading history, a range that has shown up only three times before — in November 2015, March 2020, and August 2022. Each instance was followed by a substantial price run higher.
The ripple:native monthly chart is screaming.
2017 — XRP exploded.
2021 — XRP exploded.
2024 — XRP exploded.
Is 2026 next?
Ripple before every major rally, this momentum indicator reached the same extreme low zone.
Now it’s back at historical levels once again. pic.twitter.com/ElwEx7ANPW— Celal Kucuker (@CelalKucuker) June 3, 2026
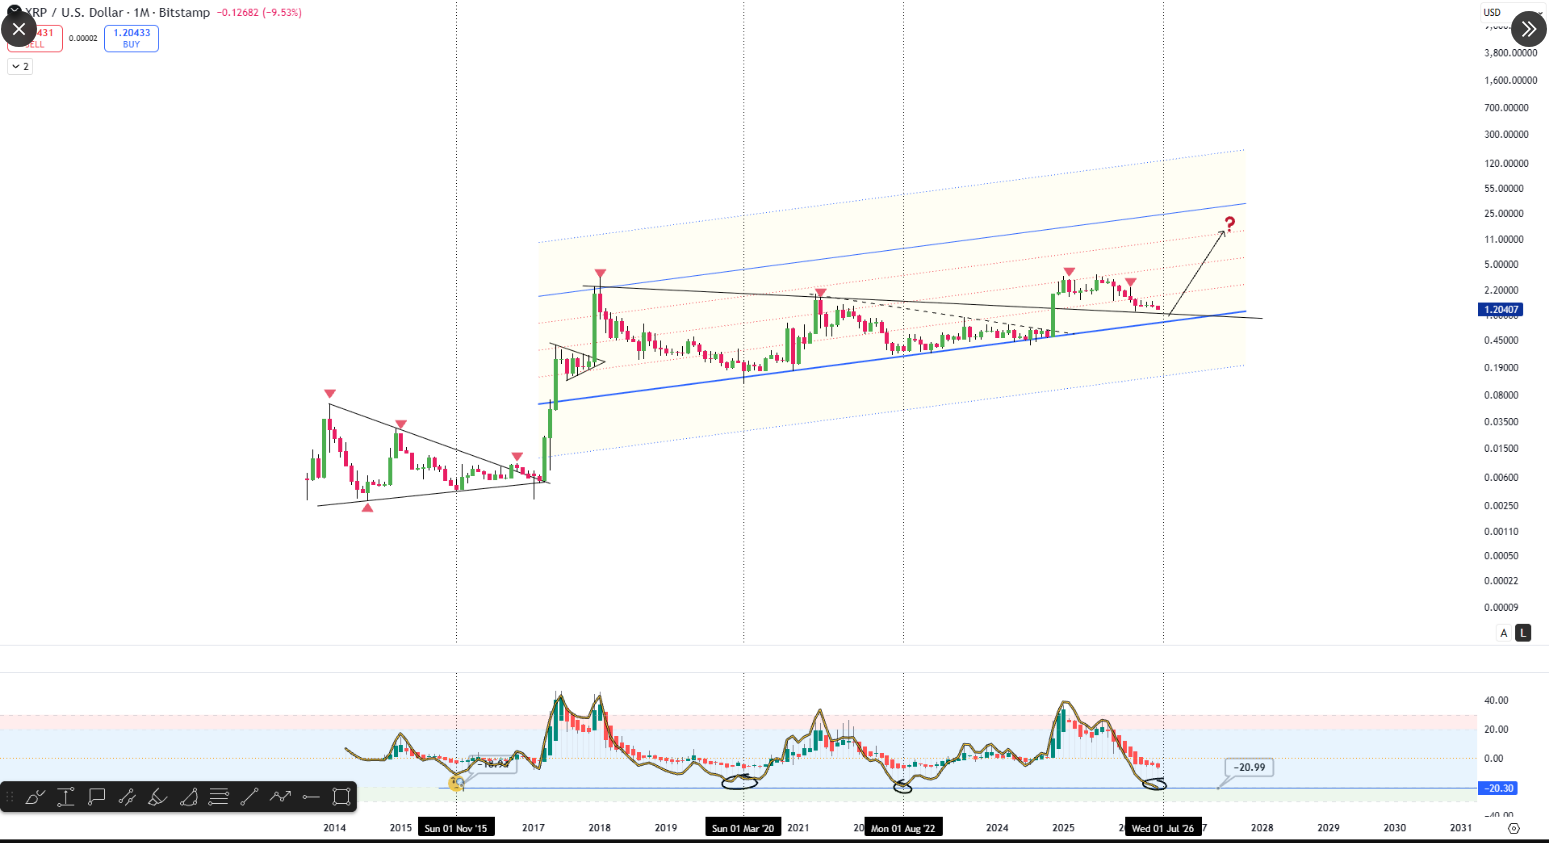
The 2015 episode came while XRP was trading inside a symmetrical triangle pattern, with the price having pulled back sharply to around $0.0040 and the monthly RSI landing at 46.7.
var rnd = window.rnd || Math.floor(Math.random()*10e6); var pid607472 = window.pid607472 || rnd; var plc607472 = window.plc607472 || 0; var abkw = window.abkw || ''; var absrc = 'https://servedbyadbutler.com/adserve/;ID=172179;size=0x0;setID=607472;type=js;sw='+screen.width+';sh='+screen.height+';spr='+window.devicePixelRatio+';kw='+abkw+';pid='+pid607472+';place='+(plc607472++)+';rnd='+rnd+';click=CLICK_MACRO_PLACEHOLDER'; document.write('
');
if (!window.AdButler){(function(){var s = document.createElement("script"); s.async = true; s.type = "text/javascript";s.src = "https://servedbyadbutler.com/app.js";var n = document.getElementsByTagName("script")[0]; n.parentNode.insertBefore(s, n);}());}
var AdButler = AdButler || {}; AdButler.ads = AdButler.ads || []; var abkw = window.abkw || ""; var plc452518 = window.plc452518 || 0; (function(){ var divs = document.querySelectorAll(".plc452518:not([id])"); var div = divs[divs.length-1]; div.id = "placement_452518_"+plc452518; AdButler.ads.push({handler: function(opt){ AdButler.register(172179, 452518, [728,90], "placement_452518_"+opt.place, opt); }, opt: { place: plc452518++, keywords: abkw, domain: "servedbyadbutler.com", click:"CLICK_MACRO_PLACEHOLDER" }}); })();
That setup preceded the broad 2017 rally cycle. In March 2020, during a period of widespread market selling, the monthly RSI fell to 43.7 and the token reached a low near $0.104 before rebounding to $1.97 by April 2021.
A third occurrence came in August 2022, when prices dropped to $0.31 and the RSI reached 43.9. XRP eventually climbed to $3.40 by January 2025.
What The Chart Is Showing Now
XRP has dropped more than 10% in June alone, with the first four days of the month bringing the token to multi-month lows around $1.18. A 9% decline was recorded in the last week.
var rnd = window.rnd || Math.floor(Math.random()*10e6); var pid607473 = window.pid607473 || rnd; var plc607473 = window.plc607473 || 0; var abkw = window.abkw || ''; var absrc = 'https://servedbyadbutler.com/adserve/;ID=172179;size=0x0;setID=607473;type=js;sw='+screen.width+';sh='+screen.height+';spr='+window.devicePixelRatio+';kw='+abkw+';pid='+pid607473+';place='+(plc607473++)+';rnd='+rnd+';click=CLICK_MACRO_PLACEHOLDER'; document.write('
');
if (!window.AdButler){(function(){var s = document.createElement("script"); s.async = true; s.type = "text/javascript";s.src = 'https://servedbyadbutler.com/app.js';var n = document.getElementsByTagName("script")[0]; n.parentNode.insertBefore(s, n);}());}
var AdButler = AdButler || {}; AdButler.ads = AdButler.ads || []; var abkw = window.abkw || ''; var plc452519 = window.plc452519 || 0; (function(){ var divs = document.querySelectorAll(".plc452519:not([id])"); var div = divs[divs.length-1]; div.id = "placement_452519_"+plc452519; AdButler.ads.push({handler: function(opt){ AdButler.register(172179, 452519, [728,90], 'placement_452519_'+opt.place, opt); }, opt: { place: plc452519++, keywords: abkw, domain: 'servedbyadbutler.com', click:'CLICK_MACRO_PLACEHOLDER' }}); })();
Despite the selling pressure, reports indicate the token has held above the lower boundary of the ascending channel that has contained its price movements for nearly a decade.
Kucuker’s analysis highlights that what sets the current setup apart is the combination of two conditions occurring together: price holding at long-term structural support while the monthly momentum indicator has already fallen back to historically low ground.

Bleeding Bitcoin Holders Signal Stress — $60K Becomes Critical Battleground
In prior cycles, momentum reached these depths either at the same time as the price bottom or just before a sustained recovery began.
The Channel’s Upper End In Sight
Should the same pattern play out, the initial price target would be the upper resistance line of the ascending channel. Reports note that each time XRP has tested the channel’s lower support, it has eventually moved toward the upper boundary.
Featured image from Gemini, chart from TradingView
0
0
Disclaimer: The content of this article solely reflects the author's opinion and does not represent the platform in any capacity. This article is not intended to serve as a reference for making investment decisions.
Understand the market, then trade.
Bitget offers one-stop trading for cryptocurrencies, stocks, and gold.
Trade now!
You may also like
The script at the end of 2018: The Federal Reserve continued to raise interest rates, US stocks plunged 20% from the September highs, forcing the Federal Reserve to "pivot" in January.
Goldman Sachs' head of trading believes the current US stock market is repeating the scenario of late 2018, with monetary tightening and equity market pressure. The Goldman Sachs Financial Conditions Index has tightened by about 8 points in two weeks, reaching the highest level in a year. The selloff has broadened from tech stocks to defensive sectors. Gold and equities are declining simultaneously, possibly indicating investors are selling assets to raise cash, making gold a key indicator for observing liquidity stress.
华尔街见闻•2026/11/21 05:31

Goldman Sachs Trader “Revisits the 2018 Playbook”: Still Clearly Remembers “On December 24th, Clients Asked Why the Market Dropped So Much—And I Had No Idea”
Brian Garrett pointed out that the current adjustment in the US stock market is similar to the sharp decline in Q4 2018: the S&P 500 has already experienced 42% of the corresponding drop, and the VIX is approaching its peak just before Christmas. If history repeats itself, the bottom of this cycle may appear in January next year. However, the credit market and Federal Reserve policy have yet to provide clear signals of a bottom.
华尔街见闻•2026/11/21 03:51
Anthropic (ANT.US) nearly “broke issue price,” but Claude knocks on the doors of “the highest peak in mathematics”! 17 million lines of Lean code used to write a candidate proof for the Riemann Hypothesis
On November 20th, Eastern Time, on its second day of trading, Anthropic's intraday price dropped to a low of $83.05, just 5 cents above the offering price of $83, and finally closed at $88.91, a decline of 8.50%. On the same day, the company's mathematician Levant Alperg announced on his personal website that he and Claude had found a candidate proof for the Riemann hypothesis, which has puzzled the mathematics community for 167 years, and released about 17 million lines of Lean formalized code.
智通财经•2026/11/21 03:21

As US stocks plummet, the parent company of GTA 6 rises against the market! First-day sales hit a record $3.79 billion; Wall Street shifts focus to next-generation GTA Online.
According to Rentrak data, the global box office of "Grand Theft Auto VI" has also surpassed that of "Avengers: Endgame," the highest-grossing film of all time, which has a global box office of approximately $2.94 billion.
智通财经•2026/11/21 02:41

Crypto prices
More
Bitcoin
BTC
$59,862.41
+0.86%

Ethereum
ETH
$1,677.7
+2.17%

Tether USDt
USDT
$0.9979
-0.07%

BNB
BNB
$544.69
-0.85%

USDC
USDC
$0.9999
+0.02%

XRP
XRP
$0.9272
+1.53%

Solana
SOL
$70.22
+2.10%

TRON
TRX
$0.3046
+0.46%

Hyperliquid
HYPE
$60.41
-2.22%

Zcash
ZEC
$785.68
+1.37%
How to buy BTC
Bitget lists BTC – Buy or sell BTC quickly on Bitget!
Trade now
Become a trader now?A welcome pack worth 6200 USDT for new users!
Sign up now