
BTC Market Pulse: Week 11

Overview
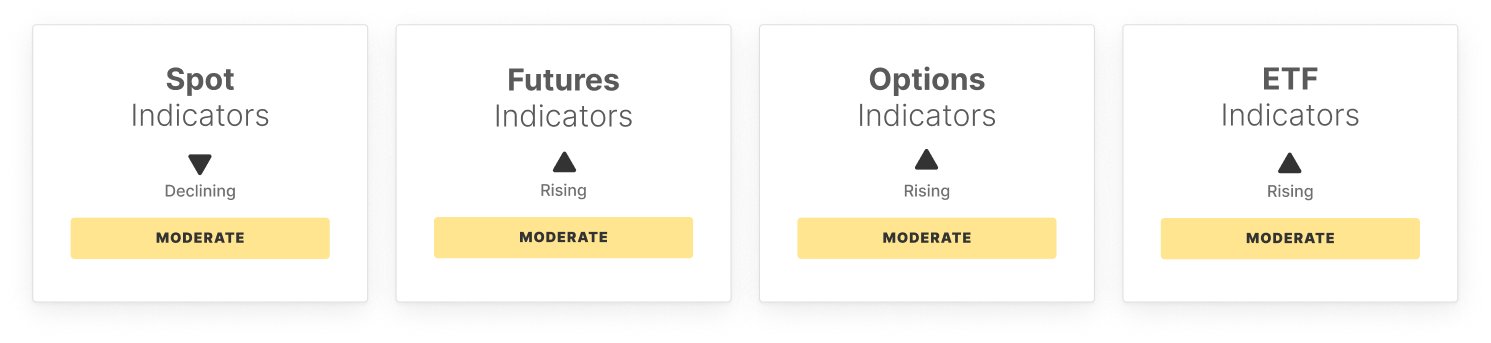
Bitcoin pulled back from $74k, while internals showed tentative signs of improvement. Momentum has firmed modestly, with RSI lifting from recent lows, but price action still lacks the strength of a decisive bullish shift. Spot activity remains subdued, with lower trading volume pointing to softer participation even as conditions begin to stabilize.
Derivatives positioning is mixed. Futures open interest increased, signalling modest leverage build-up, while long-side funding turned sharply negative, reflecting stronger demand for short exposure. Perpetual CVD rose aggressively, suggesting buy-side activity is returning in leveraged markets, though conviction remains limited.
Options markets have become less defensive. The volatility spread narrowed meaningfully as implied volatility moves closer to realised conditions, while 25-delta skew declined, pointing to softer demand for downside hedging and a more balanced near-term backdrop.
ETF activity remains a relative area of strength. Net inflows accelerated and trading volumes picked up, highlighting continued traditional finance engagement. However, the ETF MVRV ratio fell sharply into negative territory, showing the average ETF holder is now underwater and positioning stress remains elevated.
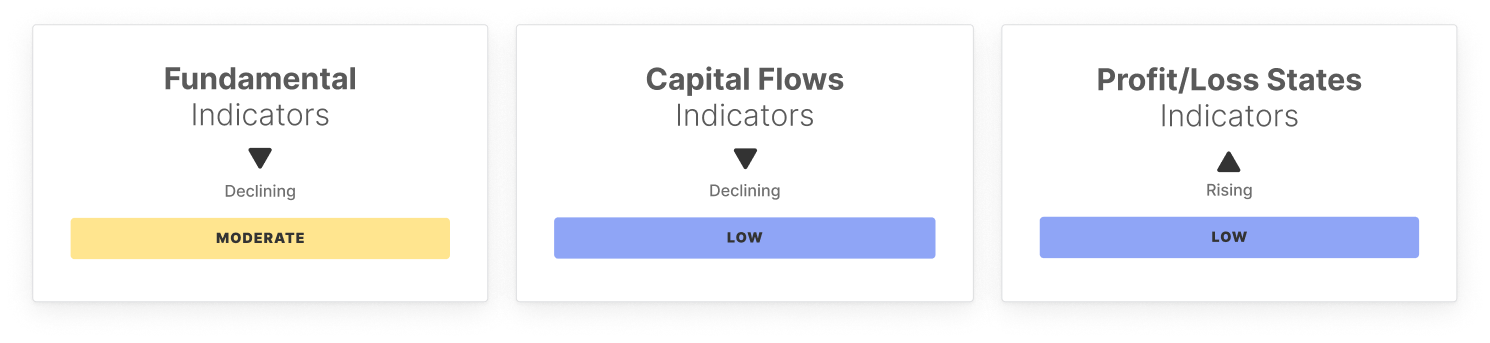
On-chain signals are mixed but slightly constructive. Transfer volume improved, pointing to firmer capital movement, while active addresses and fee volume remain soft, consistent with a quieter network backdrop. Realized cap change is still negative, though outflows are easing slightly, suggesting capital pressure may be starting to stabilize.
Positioning and profitability metrics still reflect a fragile but improving structure. The STH/LTH supply ratio remains elevated, showing short-term participation is still high, while hot capital share stays suppressed, signalling limited speculative churn. Meanwhile, supply in profit, NUPL, and the realized profit-to-loss ratio all improved modestly, suggesting market stress is easing.
Overall, conditions are stabilizing, with momentum, ETF demand, and profitability metrics improving modestly. However, capital flows remain soft, speculative participation is limited, and broader conviction has yet to fully return.
Off-Chain Indicators
On-Chain Indicators

Don't miss it!
Smart market intelligence, straight to your inbox.
Disclaimer: The content of this article solely reflects the author's opinion and does not represent the platform in any capacity. This article is not intended to serve as a reference for making investment decisions.
You may also like
Anthropic (ANT.US) rises 17% on its first day of listing, but volatility risk remains! Wall Street warns: Don't rush to chase highs, stock price may experience severe fluctuations in the coming weeks
Anthropic (ANT.US)'s unprecedented initial public offering (IPO) on Thursday injected much-needed momentum into the US stock market, which had experienced several weeks of weakness. However, analysts warn that the stock price may continue to fluctuate in the coming weeks.

SpaceX (SPCX.US) Raises More Funds for AI Chips: Issues $32 Billion Bonds to Purchase Nvidia GPUs
SpaceX sold artificial intelligence chip bonds worth $32 billion, with a yield exceeding 8%.

Falling below 3600, gold is set for its worst week since March
Spot gold hit an intraday low of $3,520, having pulled back by more than one-third from its all-time high. The combined pressures of hawkish signals from the Federal Reserve, sell-offs in tech stocks, and a stronger US dollar have pushed the 10-year US Treasury yield above 5% for 29 consecutive days. From a technical perspective, there is almost no support before the $3,300 to $3,400 range. Standard Chartered attributes the current decline to a shift in gold's role—from a “portfolio safe-haven asset” to a “liquidity provider.”
Crypto prices
More


