
Nonfarm Payrolls Preview! Unemployment Rate Hits the Critical 4.4% Threshold—Will the U.S. Economy Fall Off a Cliff?

FXStreet, February 10—— This week, the United States will release both the January Nonfarm Payrolls (NFP) data and the Consumer Price Index (CPI). These two key reports will directly determine the pace of the Federal Reserve’s interest rate cuts in 2026, and even whether rate cuts will occur at all, becoming critical references for the market to judge the U.S. economy and monetary policy.
Last autumn, a sluggish and volatile labor market was the core concern of the Federal Reserve. To hedge against the risks of rising unemployment and a sharp cooling in hiring, the Fed cut the benchmark interest rate three times by the end of 2025, making every effort to stabilize the job market.
Now, market focus has shifted back to the persistent issue of high inflation.
The U.S. Bureau of Labor Statistics (BLS) releases its annual benchmark revision in the January employment situation report (usually published in February) every year.

Labor Market: Stabilization and Divergence Coexist, Supporting a Pause in Rate Cuts
In the summer of 2025, the U.S. saw a contraction in jobs, but the last two months of the year saw a phase of recovery in hiring. The unemployment rate, after hitting a four-year high, edged down to 4.4% in December.
However, there are clear divergences in market expectations for the job outlook: The Federal Reserve believes the labor market has stabilized, but some Wall Street institutions point out that job vacancies have dropped sharply and the fundamentals of employment are still deteriorating.
Based on confidence in the job market, the Fed voted 10:2 at the end of January to pause rate cuts, the first time in four meetings to hold its position. Most officials have no plans for rate cuts in the short term due to unmet inflation targets.
Inflation Trend: Short-term Slowdown with Upside Risks Remaining
On the inflation front, January data is expected to show a slight slowdown, with institutions forecasting both headline and core CPI to rise 0.3% month-on-month, and decline year-on-year to 2.5%.
The mainstream view is that the impact of tariffs will gradually fade in 2026, and slower increases in housing and labor costs will help inflation continue to move closer to the 2% target.
Policy Impact: Data Results Determine Pace of Rate Cuts and Market Direction
Domestic employers announced 108,435 layoffs in the month, up 118% year-on-year and 205% month-on-month, marking the highest level for the same period since January 2009 and the single-month peak since October 2025;
Summary and Technical Analysis:
The most important observation for this nonfarm payrolls report remains the unemployment rate. According to the Sahm Rule, when the three-month moving average of U.S. unemployment rises by 0.5 percentage points above the lowest point of the previous 12 months, the economy officially enters a recession. That 0.5% threshold is at 4.4%. Economists also believe the Beveridge curve inflection point is at 4.4%. Exceeding this point means the labor market is not just cooling, but in recession. Empirically, in July 2024, the unemployment rate once touched 4.3%, which triggered a global “Black Monday” market rout.
Technical indicators show the U.S. dollar index fell on Monday,
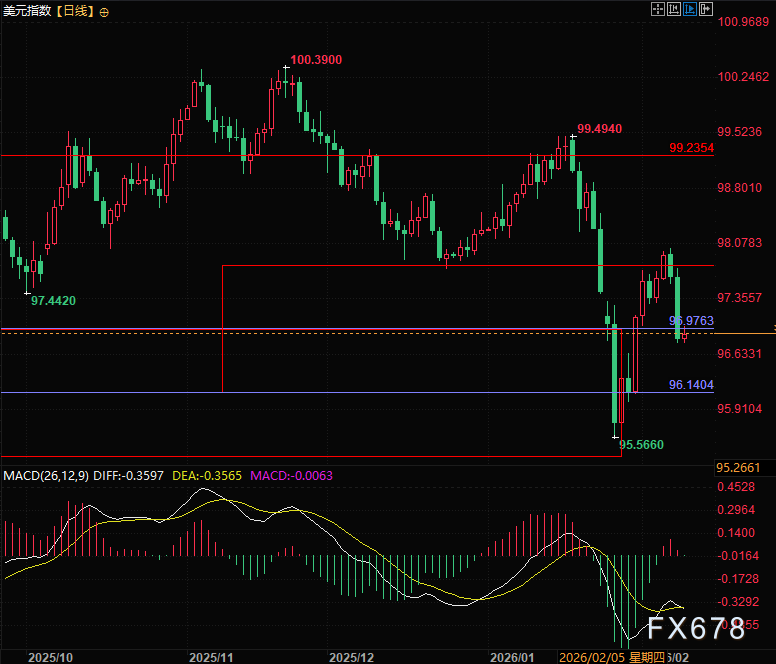
(U.S. Dollar Index daily chart, source: Yihuitong)
As of 15:57 Beijing time (UTC+8), the U.S. dollar index is at 96.91.
Disclaimer: The content of this article solely reflects the author's opinion and does not represent the platform in any capacity. This article is not intended to serve as a reference for making investment decisions.
You may also like
The script at the end of 2018: The Federal Reserve continued to raise interest rates, US stocks plunged 20% from the September highs, forcing the Federal Reserve to "pivot" in January.
Goldman Sachs' head of trading believes the current US stock market is repeating the scenario of late 2018, with monetary tightening and equity market pressure. The Goldman Sachs Financial Conditions Index has tightened by about 8 points in two weeks, reaching the highest level in a year. The selloff has broadened from tech stocks to defensive sectors. Gold and equities are declining simultaneously, possibly indicating investors are selling assets to raise cash, making gold a key indicator for observing liquidity stress.

Goldman Sachs Trader “Revisits the 2018 Playbook”: Still Clearly Remembers “On December 24th, Clients Asked Why the Market Dropped So Much—And I Had No Idea”
Brian Garrett pointed out that the current adjustment in the US stock market is similar to the sharp decline in Q4 2018: the S&P 500 has already experienced 42% of the corresponding drop, and the VIX is approaching its peak just before Christmas. If history repeats itself, the bottom of this cycle may appear in January next year. However, the credit market and Federal Reserve policy have yet to provide clear signals of a bottom.
Anthropic (ANT.US) nearly “broke issue price,” but Claude knocks on the doors of “the highest peak in mathematics”! 17 million lines of Lean code used to write a candidate proof for the Riemann Hypothesis
On November 20th, Eastern Time, on its second day of trading, Anthropic's intraday price dropped to a low of $83.05, just 5 cents above the offering price of $83, and finally closed at $88.91, a decline of 8.50%. On the same day, the company's mathematician Levant Alperg announced on his personal website that he and Claude had found a candidate proof for the Riemann hypothesis, which has puzzled the mathematics community for 167 years, and released about 17 million lines of Lean formalized code.

As US stocks plummet, the parent company of GTA 6 rises against the market! First-day sales hit a record $3.79 billion; Wall Street shifts focus to next-generation GTA Online.
According to Rentrak data, the global box office of "Grand Theft Auto VI" has also surpassed that of "Avengers: Endgame," the highest-grossing film of all time, which has a global box office of approximately $2.94 billion.

Crypto prices
More


