Bitget App
Trade smarter
Buy cryptoMarketsTradeFuturesStocksEarnInstitutionAI & More
Pump.fun (PUMP) Slides Lower – Could This Emerging Pattern Spark a Bounce Back?

Pump.fun (PUMP) Slides Lower – Could This Emerging Pattern Spark a Bounce Back?

CoinsProbeCoinsProbe2025/09/19 18:36
By:Nilesh Hembade

Date: Fri, Sept 19, 2025 | 10:40 AM GMT

The cryptocurrency market is witnessing a mild retracement today after the initial surge that followed the Fed’s rate cut decision. Both Bitcoin (BTC) and Ethereum (ETH) are trading slightly lower, and the weakness has spilled over into altcoins , including Pump.fun (PUMP).

Despite today’s red candles, PUMP has been one of the best-performing tokens over the past 30 days, rallying over 140% in that period. Currently down by over 9%, the chart is hinting at something interesting — the possible formation of a “Power of 3” (PO3) pattern that may set the stage for a sharp rebound.

Pump.fun (PUMP) Slides Lower – Could This Emerging Pattern Spark a Bounce Back? image 0 Source: Coinmarketcap

Power of 3 Pattern in Play?

On the 2H chart, PUMP is showing early signs of a Power of 3 setup, a classic structure often characterized by three distinct phases:

Accumulation Phase
For nearly a week, PUMP consolidated inside a broad range between $0.00873 (resistance) and $0.00750 (support). This sideways action suggested quiet accumulation by larger players, while volatility compressed.
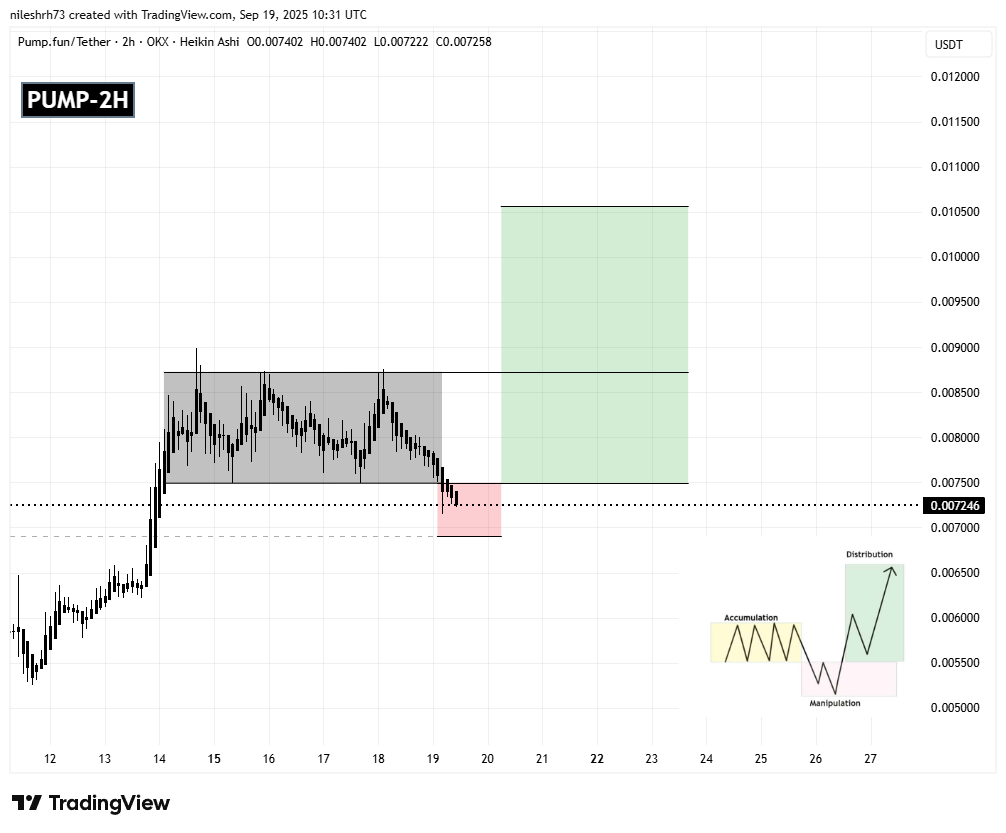
Pump.fun (PUMP) Slides Lower – Could This Emerging Pattern Spark a Bounce Back? image 1 Pump.fun (PUMP) 2H Chart/Coinsprobe (Source: Tradingview)

Manipulation Phase
Earlier today, the token slipped below the $0.00750 support, dropping into the $0.00720 zone. This red-shaded region reflects the manipulation phase, where weak holders are often shaken out via false breakdowns before price sets up for a potential reversal.

What’s Next for PUMP?

At present, PUMP is still trading inside the manipulation zone, which leaves room for another dip toward the $0.00690 support. However, if buyers step in and defend this red zone, pushing price back above $0.00750, the token could transition into the expansion phase — the most bullish leg of the setup.

A decisive breakout above $0.00873 would validate this bullish scenario, opening the way toward the $0.01056 range — an upside of more than 45% from current levels.

That said, it’s important to note that the pattern is still in its early phase and playing out on a lower timeframe (2H chart), making it riskier to fully rely on. Until PUMP reclaims the $0.00750 level, the risk of further downside remains.


0
0

Disclaimer: The content of this article solely reflects the author's opinion and does not represent the platform in any capacity. This article is not intended to serve as a reference for making investment decisions.

Understand the market, then trade.
Bitget offers one-stop trading for cryptocurrencies, stocks, and gold.
Trade now!

You may also like

The script at the end of 2018: The Federal Reserve continued to raise interest rates, US stocks plunged 20% from the September highs, forcing the Federal Reserve to "pivot" in January.

Goldman Sachs' head of trading believes the current US stock market is repeating the scenario of late 2018, with monetary tightening and equity market pressure. The Goldman Sachs Financial Conditions Index has tightened by about 8 points in two weeks, reaching the highest level in a year. The selloff has broadened from tech stocks to defensive sectors. Gold and equities are declining simultaneously, possibly indicating investors are selling assets to raise cash, making gold a key indicator for observing liquidity stress.

华尔街见闻•2026/11/21 05:31
The script at the end of 2018: The Federal Reserve continued to raise interest rates, US stocks plunged 20% from the September highs, forcing the Federal Reserve to "pivot" in January.

Goldman Sachs Trader “Revisits the 2018 Playbook”: Still Clearly Remembers “On December 24th, Clients Asked Why the Market Dropped So Much—And I Had No Idea”

Brian Garrett pointed out that the current adjustment in the US stock market is similar to the sharp decline in Q4 2018: the S&P 500 has already experienced 42% of the corresponding drop, and the VIX is approaching its peak just before Christmas. If history repeats itself, the bottom of this cycle may appear in January next year. However, the credit market and Federal Reserve policy have yet to provide clear signals of a bottom.

华尔街见闻•2026/11/21 03:51

Anthropic (ANT.US) nearly “broke issue price,” but Claude knocks on the doors of “the highest peak in mathematics”! 17 million lines of Lean code used to write a candidate proof for the Riemann Hypothesis

On November 20th, Eastern Time, on its second day of trading, Anthropic's intraday price dropped to a low of $83.05, just 5 cents above the offering price of $83, and finally closed at $88.91, a decline of 8.50%. On the same day, the company's mathematician Levant Alperg announced on his personal website that he and Claude had found a candidate proof for the Riemann hypothesis, which has puzzled the mathematics community for 167 years, and released about 17 million lines of Lean formalized code.

智通财经•2026/11/21 03:21
Anthropic (ANT.US) nearly “broke issue price,” but Claude knocks on the doors of “the highest peak in mathematics”! 17 million lines of Lean code used to write a candidate proof for the Riemann Hypothesis

As US stocks plummet, the parent company of GTA 6 rises against the market! First-day sales hit a record $3.79 billion; Wall Street shifts focus to next-generation GTA Online.

According to Rentrak data, the global box office of "Grand Theft Auto VI" has also surpassed that of "Avengers: Endgame," the highest-grossing film of all time, which has a global box office of approximately $2.94 billion.

智通财经•2026/11/21 02:41
As US stocks plummet, the parent company of GTA 6 rises against the market! First-day sales hit a record $3.79 billion; Wall Street shifts focus to next-generation GTA Online.
