
Flare (FLR) Price Targets Two-Month High, But Market Sentiment Is Split

Flare (FLR) rallies toward a two-month high with strong buyer momentum, but negative funding rates highlight divided market sentiment.
FLR, the native token of the EVM-based Layer 1 blockchain network Flare, is today’s top gainer, climbing nearly 10% in the past 24 hours.
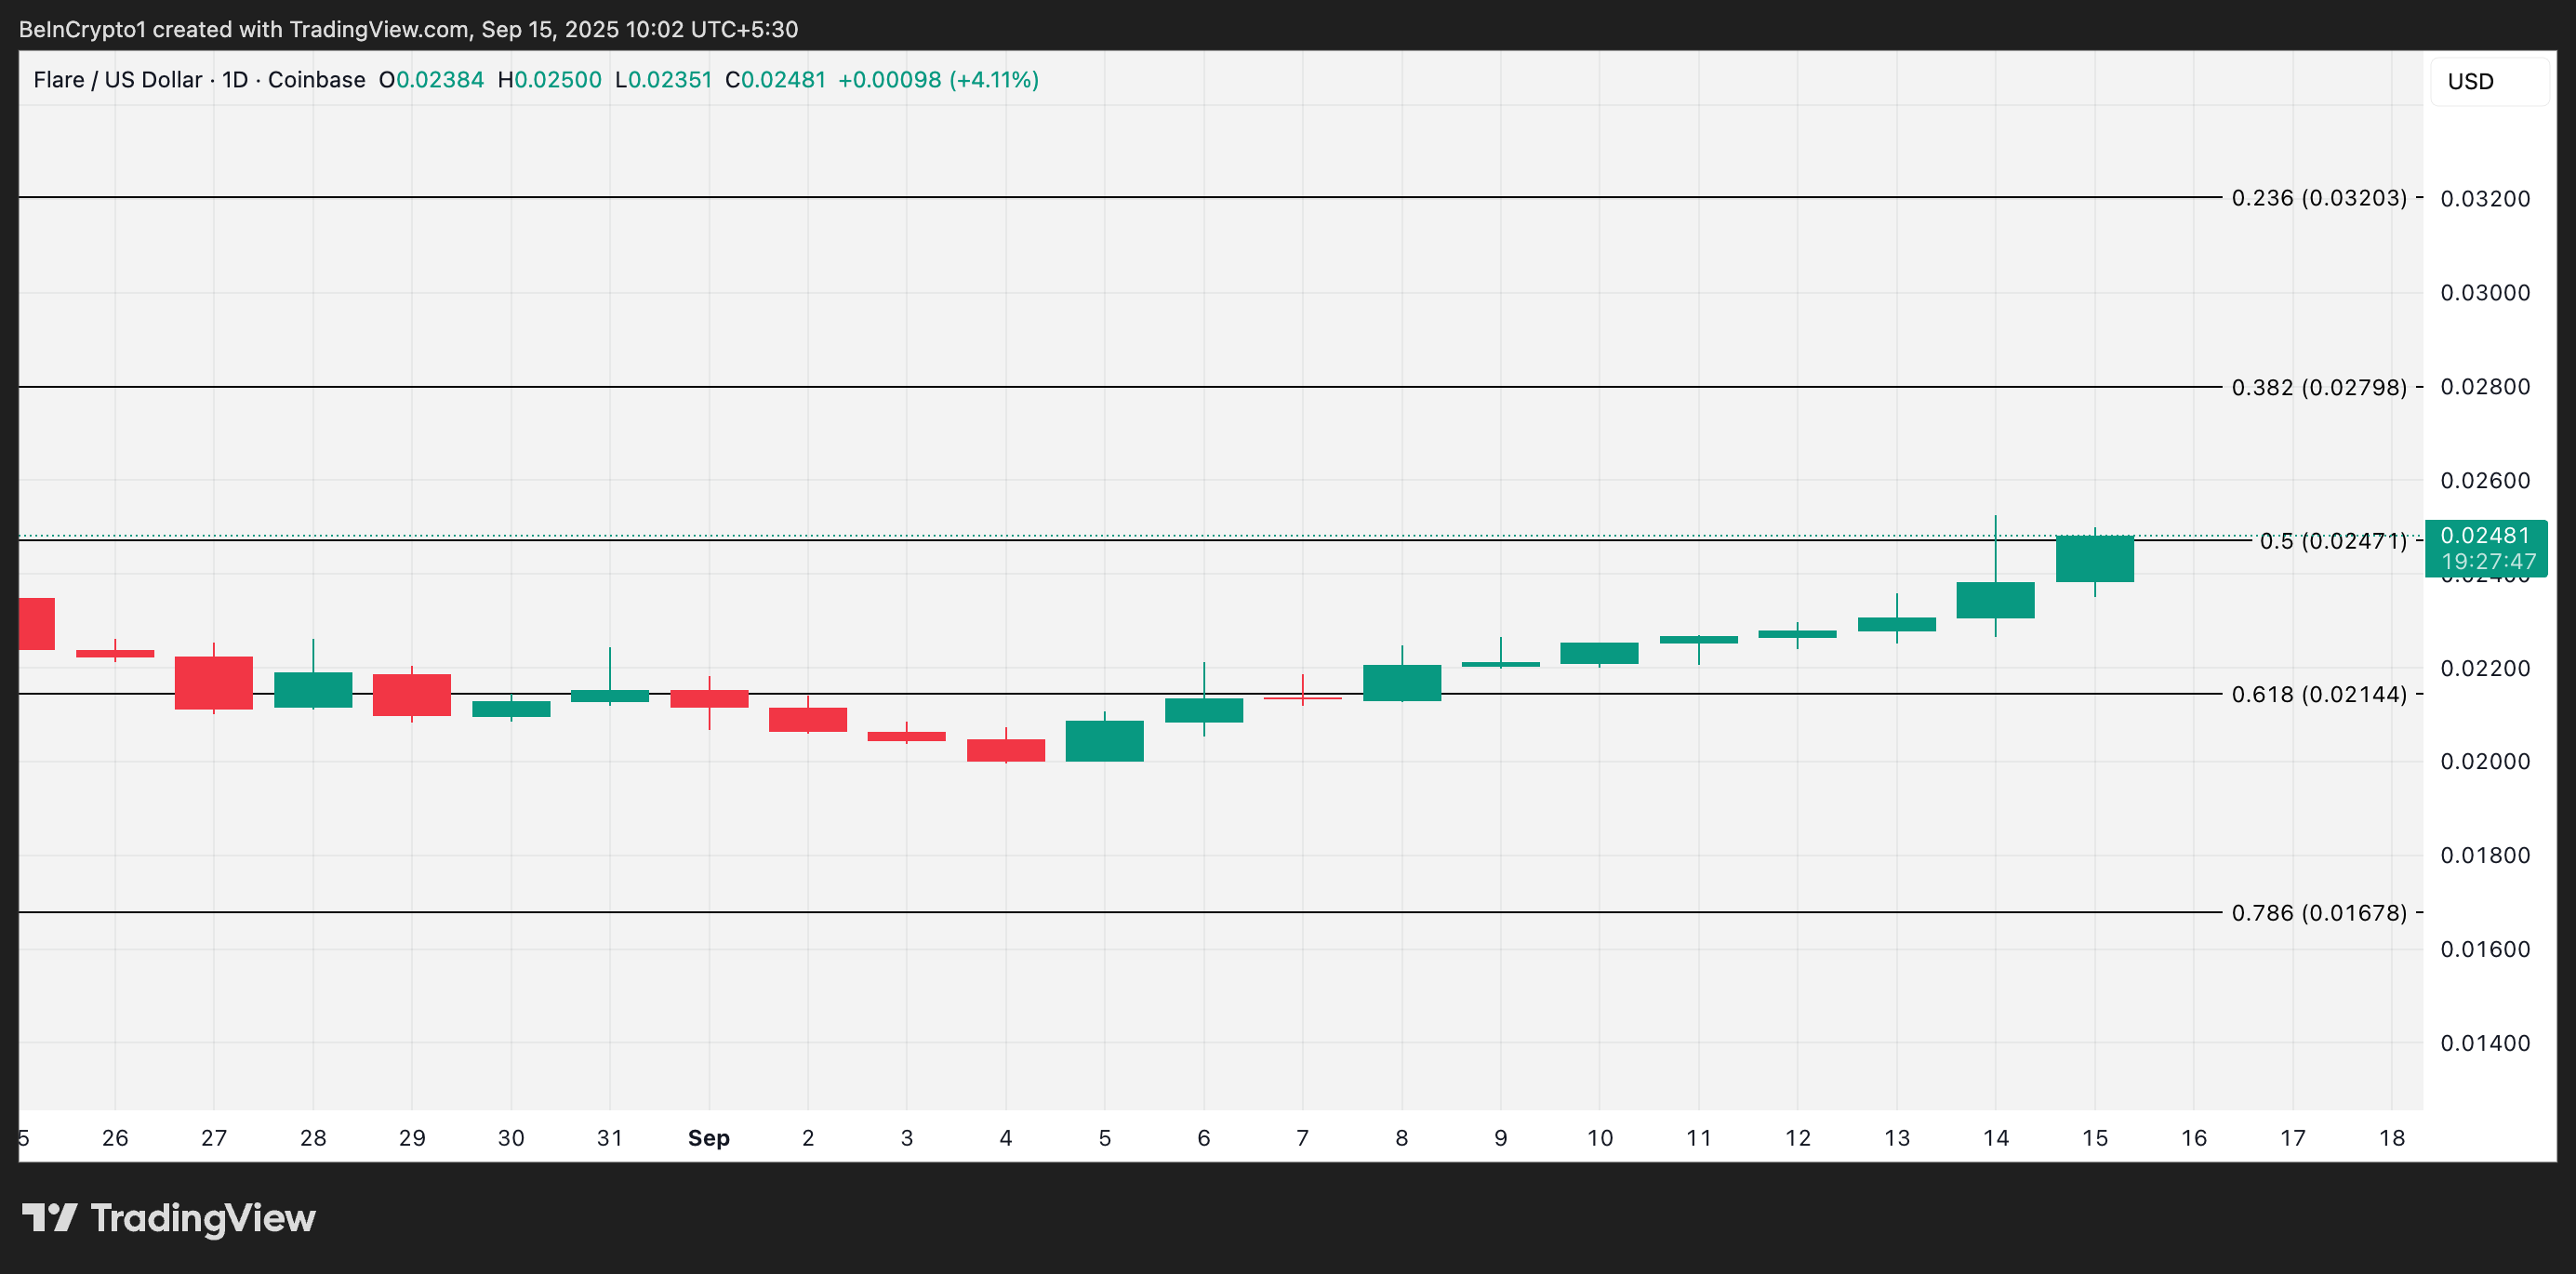
The token has steadily risen since early September, and recent price action suggests it could reach a two-month high of $0.02798 in the coming trading sessions.
FLR Eyes Higher Ground as Buyers Dominate Market
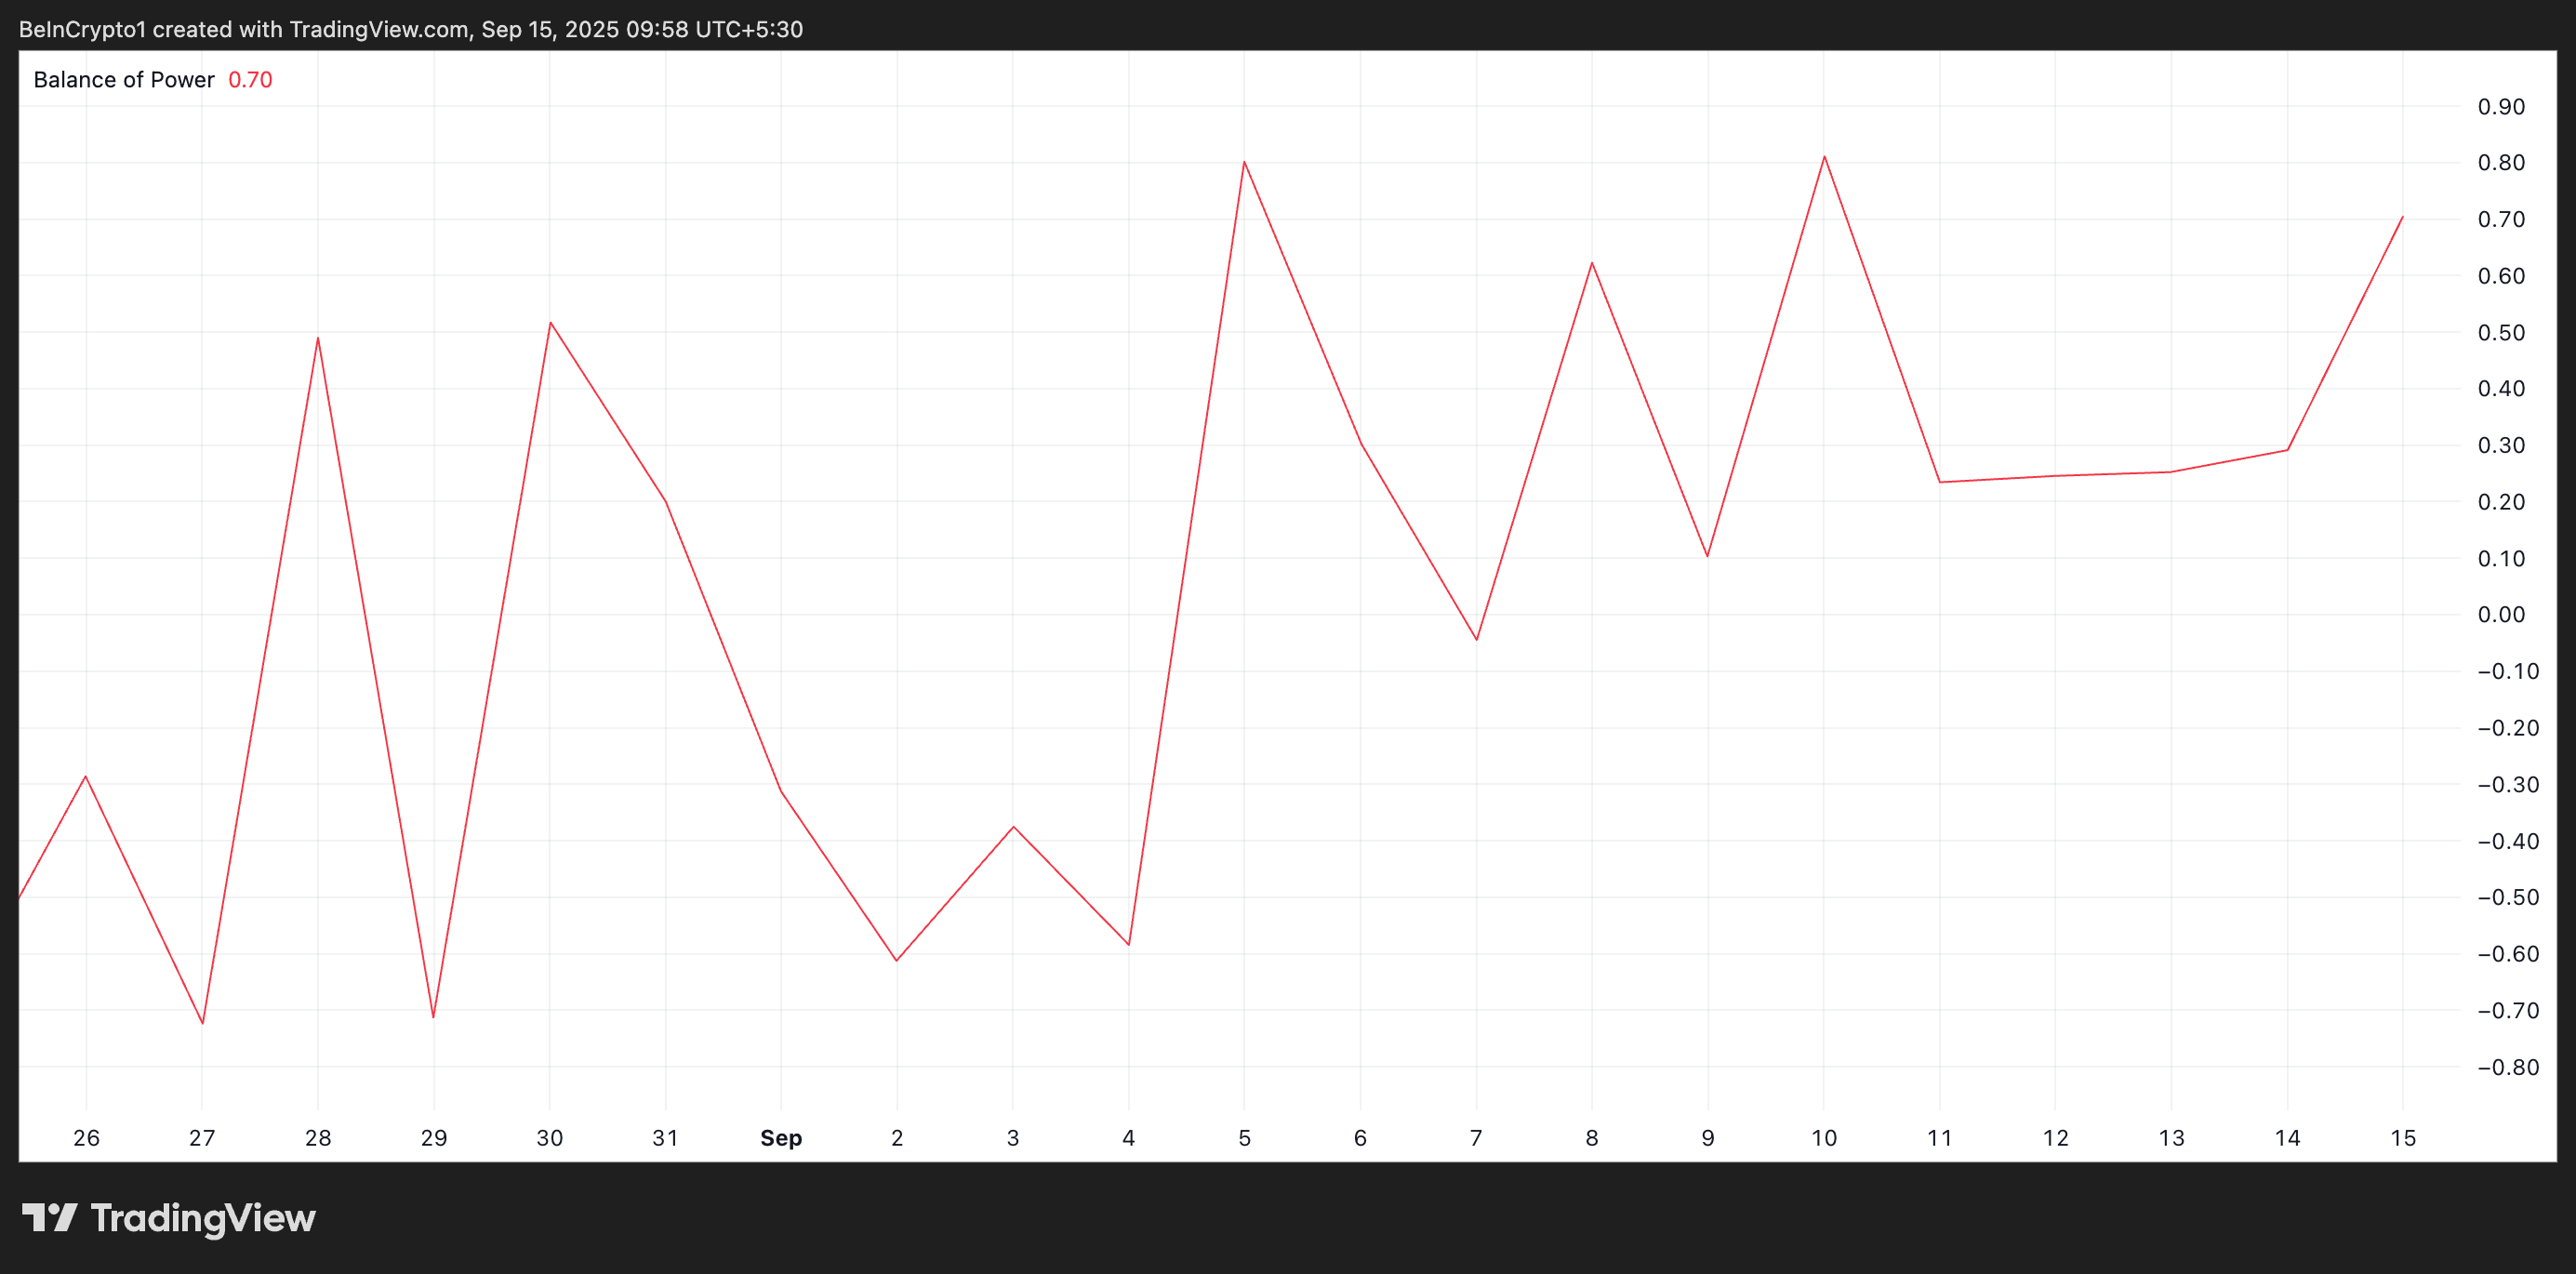
FLR’s positive Balance of Power (BoP), observed on a one-day chart, indicates strong buying momentum. As of this writing, the metric is at 0.70, reflecting that buyers are currently dominating the market.
For token TA and market updates: Want more token insights like this? Sign up for Editor Harsh Notariya’s Daily Crypto Newsletter
 FLR BoP. Source:
FLR BoP. Source
The BoP measures the strength of buyers versus sellers over a given period. When an asset’s BoP is positive, it signals that buying pressure exceeds selling pressure, pointing to bullish conditions.
Conversely, a negative BoP indicates that sellers are in control, a trend that often precedes price declines or periods of consolidation.
FLR’s current positive sentiment suggests buyers are actively pushing the price higher, strengthening the likelihood of a sustained rally.
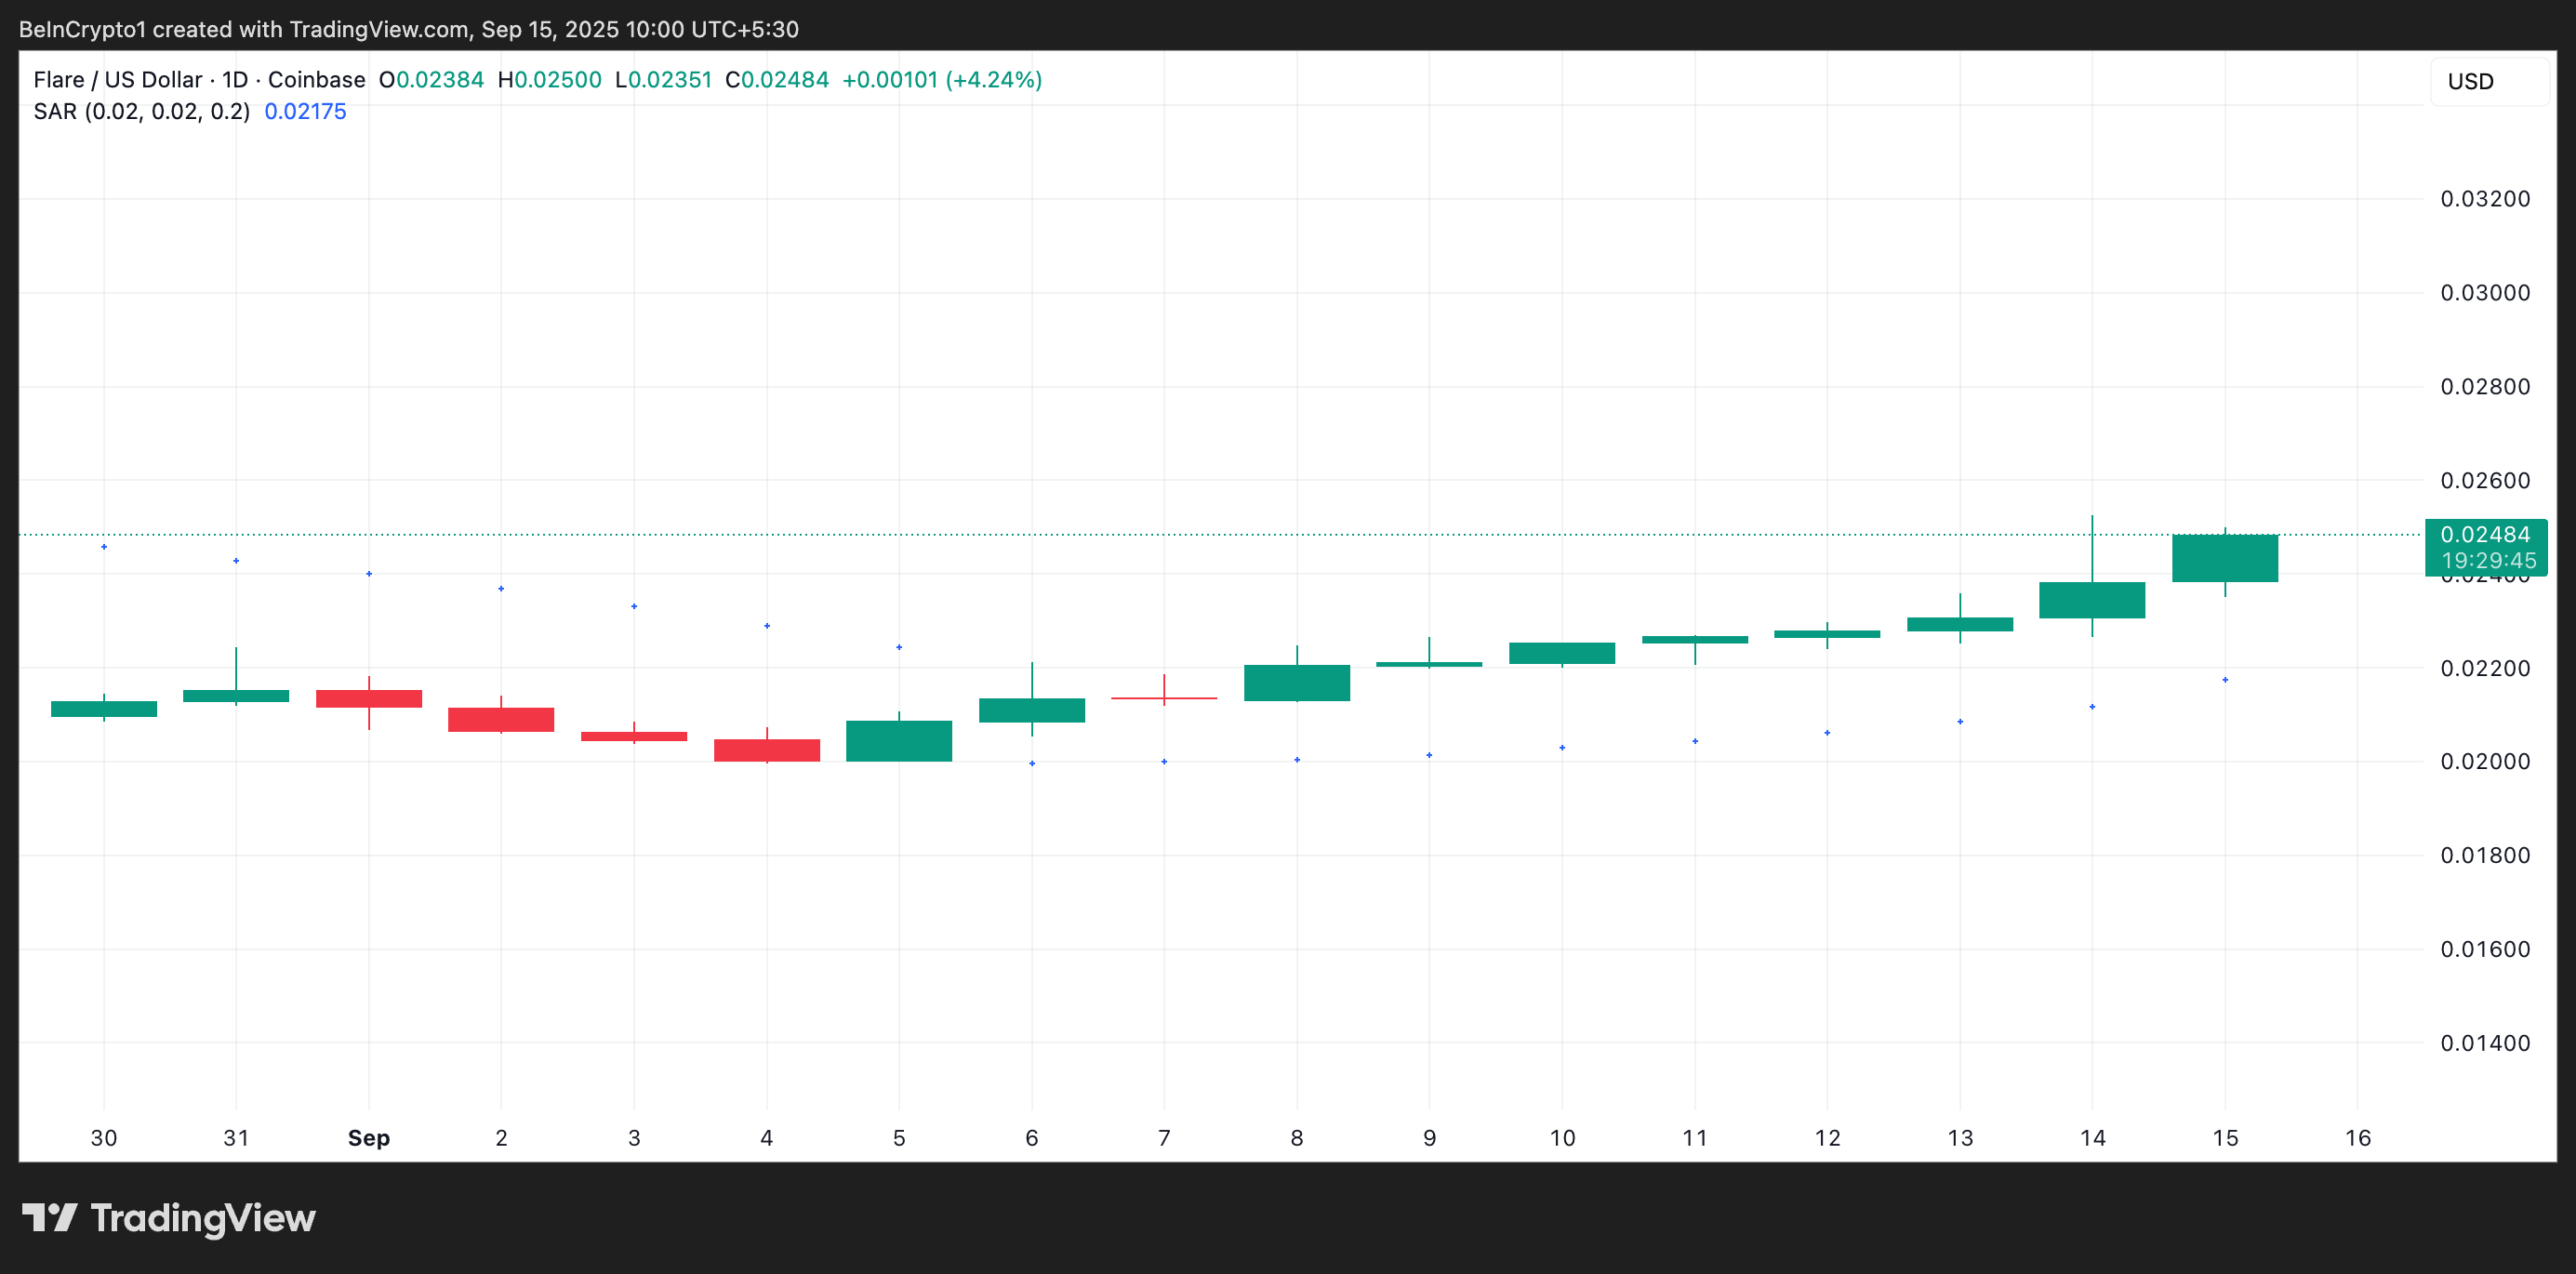
Furthermore, on the daily chart, the token sits above its Parabolic Stop and Reverse (SAR) indicator, adding to this bullish outlook. As of now, the SAR forms dynamic support below the token’s price at $0.02175, acting as a potential safety net for buyers.
 FLR Parabolic SAR. Source:
FLR Parabolic SAR. Source
The Parabolic SAR helps identify potential trend reversals and the overall direction of an asset’s price. It plots a series of dots either above or below the price to signal market trends.
When the dots are positioned below the price, as with FLR, it indicates an ongoing uptrend and that buying pressure is dominant. This means the bullish momentum is still strong and the token may continue climbing in the short term.
FLR Climbs, But Bears in Derivatives Aren’t Ready to Quit
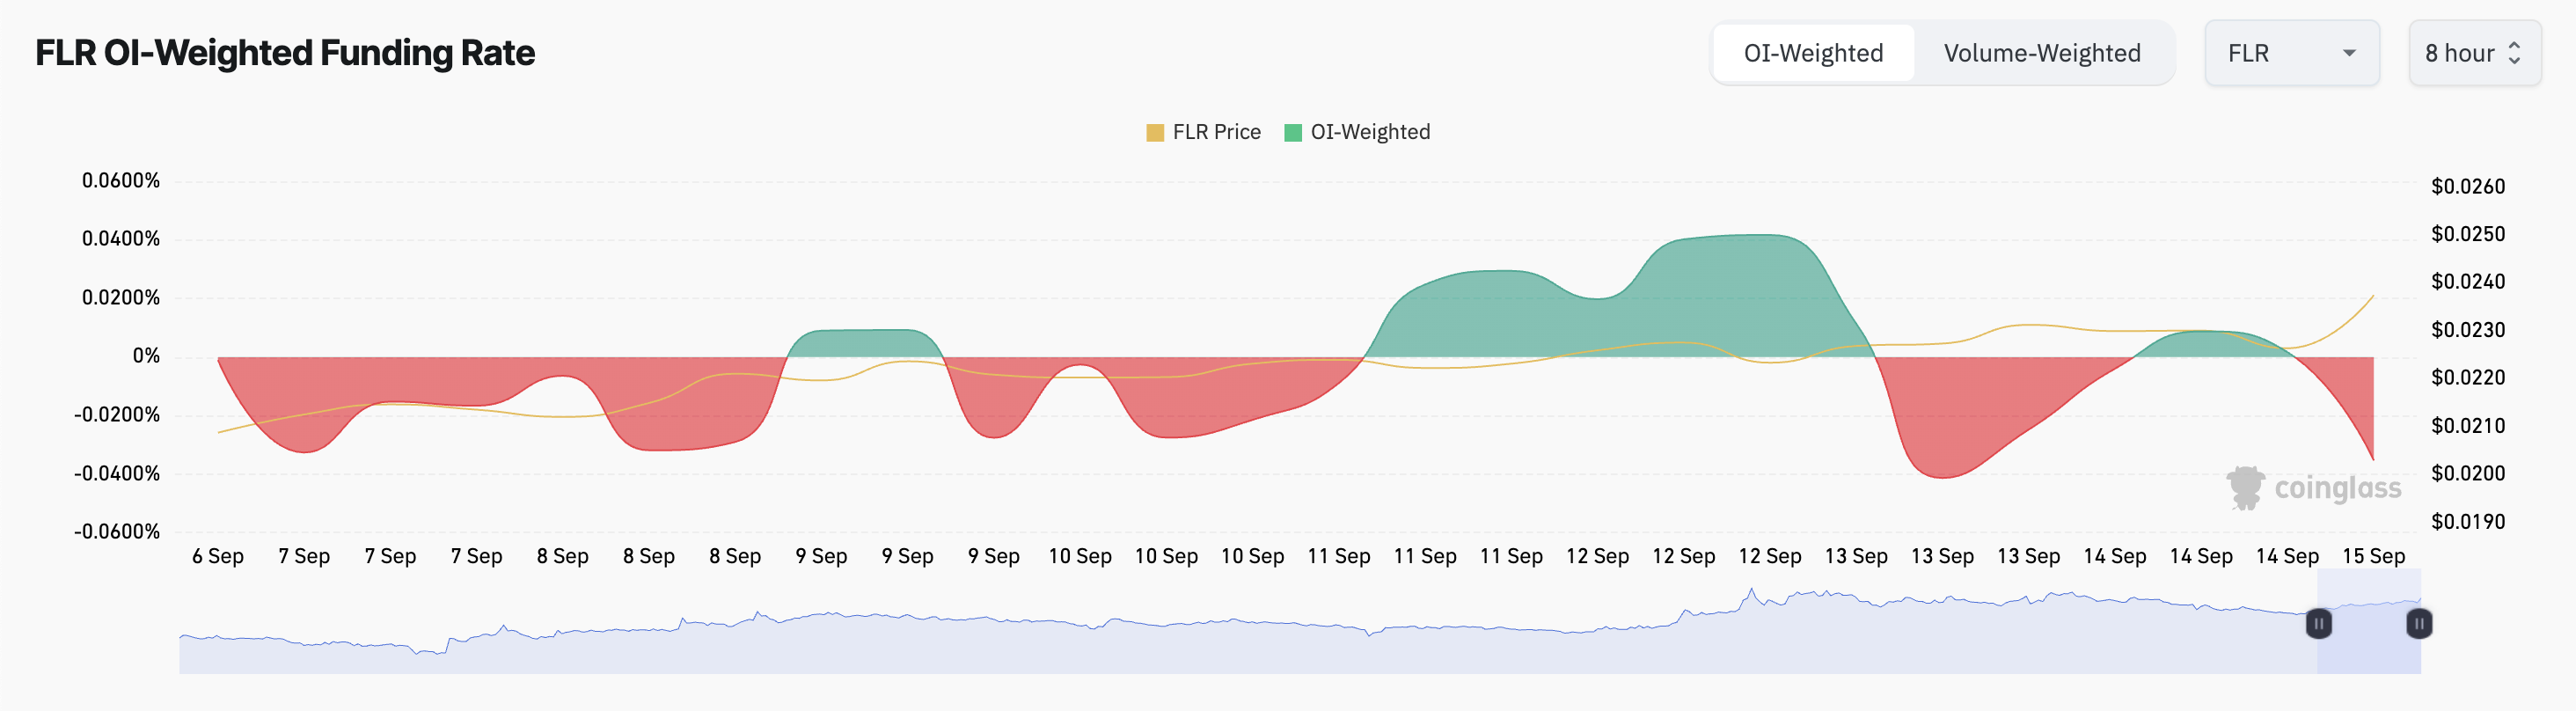
However, on-chain data suggests that derivatives traders are less optimistic about FLR’s recent rally. This is reflected in the token’s persistently negative funding rates, even as its price has surged over the past week. As of this writing, FLR’s funding rate stands at -0.0353%, according to Coinglass.
 FLR Funding Rate. Source:
FLR Funding Rate. Source
Funding rates are periodic payments exchanged between long (buy) and short (sell) positions in perpetual futures markets. They are designed to keep the contract price close to the spot price. A positive funding rate indicates that long positions are paying shorts, signaling bullish sentiment among derivatives traders.
Conversely, a negative funding rate means that shorts are paying longs, suggesting bearish sentiment or caution in the futures market.
For FLR, the negative funding rate implies that while spot traders are driving the price higher, derivatives traders are hedging against a potential pullback, highlighting a split in market confidence.
FLR Rally Hangs in the Balance—$0.028 Within Reach or Retreat to $0.021?
This divergence between spot momentum and derivatives sentiment could lead to short-term volatility, impacting FLR’s sustained rally.
If the bearish tilt in market sentiment spreads and spot traders resume profit-taking, the altcoin could shed some gains and fall to $0.02144.
 FLR Price Analysis. Source:
FLR Price Analysis. Source
However, a sustained rally could trigger a rally toward a two-month high of $0.02798.
Disclaimer: The content of this article solely reflects the author's opinion and does not represent the platform in any capacity. This article is not intended to serve as a reference for making investment decisions.
You may also like
The script at the end of 2018: The Federal Reserve continued to raise interest rates, US stocks plunged 20% from the September highs, forcing the Federal Reserve to "pivot" in January.
Goldman Sachs' head of trading believes the current US stock market is repeating the scenario of late 2018, with monetary tightening and equity market pressure. The Goldman Sachs Financial Conditions Index has tightened by about 8 points in two weeks, reaching the highest level in a year. The selloff has broadened from tech stocks to defensive sectors. Gold and equities are declining simultaneously, possibly indicating investors are selling assets to raise cash, making gold a key indicator for observing liquidity stress.

Goldman Sachs Trader “Revisits the 2018 Playbook”: Still Clearly Remembers “On December 24th, Clients Asked Why the Market Dropped So Much—And I Had No Idea”
Brian Garrett pointed out that the current adjustment in the US stock market is similar to the sharp decline in Q4 2018: the S&P 500 has already experienced 42% of the corresponding drop, and the VIX is approaching its peak just before Christmas. If history repeats itself, the bottom of this cycle may appear in January next year. However, the credit market and Federal Reserve policy have yet to provide clear signals of a bottom.
Anthropic (ANT.US) nearly “broke issue price,” but Claude knocks on the doors of “the highest peak in mathematics”! 17 million lines of Lean code used to write a candidate proof for the Riemann Hypothesis
On November 20th, Eastern Time, on its second day of trading, Anthropic's intraday price dropped to a low of $83.05, just 5 cents above the offering price of $83, and finally closed at $88.91, a decline of 8.50%. On the same day, the company's mathematician Levant Alperg announced on his personal website that he and Claude had found a candidate proof for the Riemann hypothesis, which has puzzled the mathematics community for 167 years, and released about 17 million lines of Lean formalized code.

As US stocks plummet, the parent company of GTA 6 rises against the market! First-day sales hit a record $3.79 billion; Wall Street shifts focus to next-generation GTA Online.
According to Rentrak data, the global box office of "Grand Theft Auto VI" has also surpassed that of "Avengers: Endgame," the highest-grossing film of all time, which has a global box office of approximately $2.94 billion.

Crypto prices
More


