
HBAR ETF Approval Odds Hit 90%: Can the Price Rally From Here?

The Hedera (HBAR) market just got a major catalyst. Bloomberg Terminal data shows that both Grayscale and Canary have filed for spot HBAR ETF, with the SEC setting November 11, 2025 as the final deadline. The approval odds sit at a strong 90%. That puts HBAR price in the same league as XRP, Cardano, and Polkadot, all lined up for possible approval before year-end. This development shifts Hedera price outlook from speculative to potentially institutional-grade, but the charts suggest timing will be everything.
HBAR Price Prediction: Why the HBAR ETF Deadline Matters?
ETFs are the bridge between traditional finance and crypto. A spot HBAR ETF means pension funds, hedge funds, and retail investors could gain exposure without touching crypto exchanges. With Grayscale’s involvement, liquidity is almost guaranteed if the product goes live. The November deadline sets a clear timeline for when this narrative could ignite. Between now and then, price will likely be shaped by positioning and speculative accumulation ahead of approval.
HBAR Price Prediction: Short-Term Weakness, Long-Term Setup
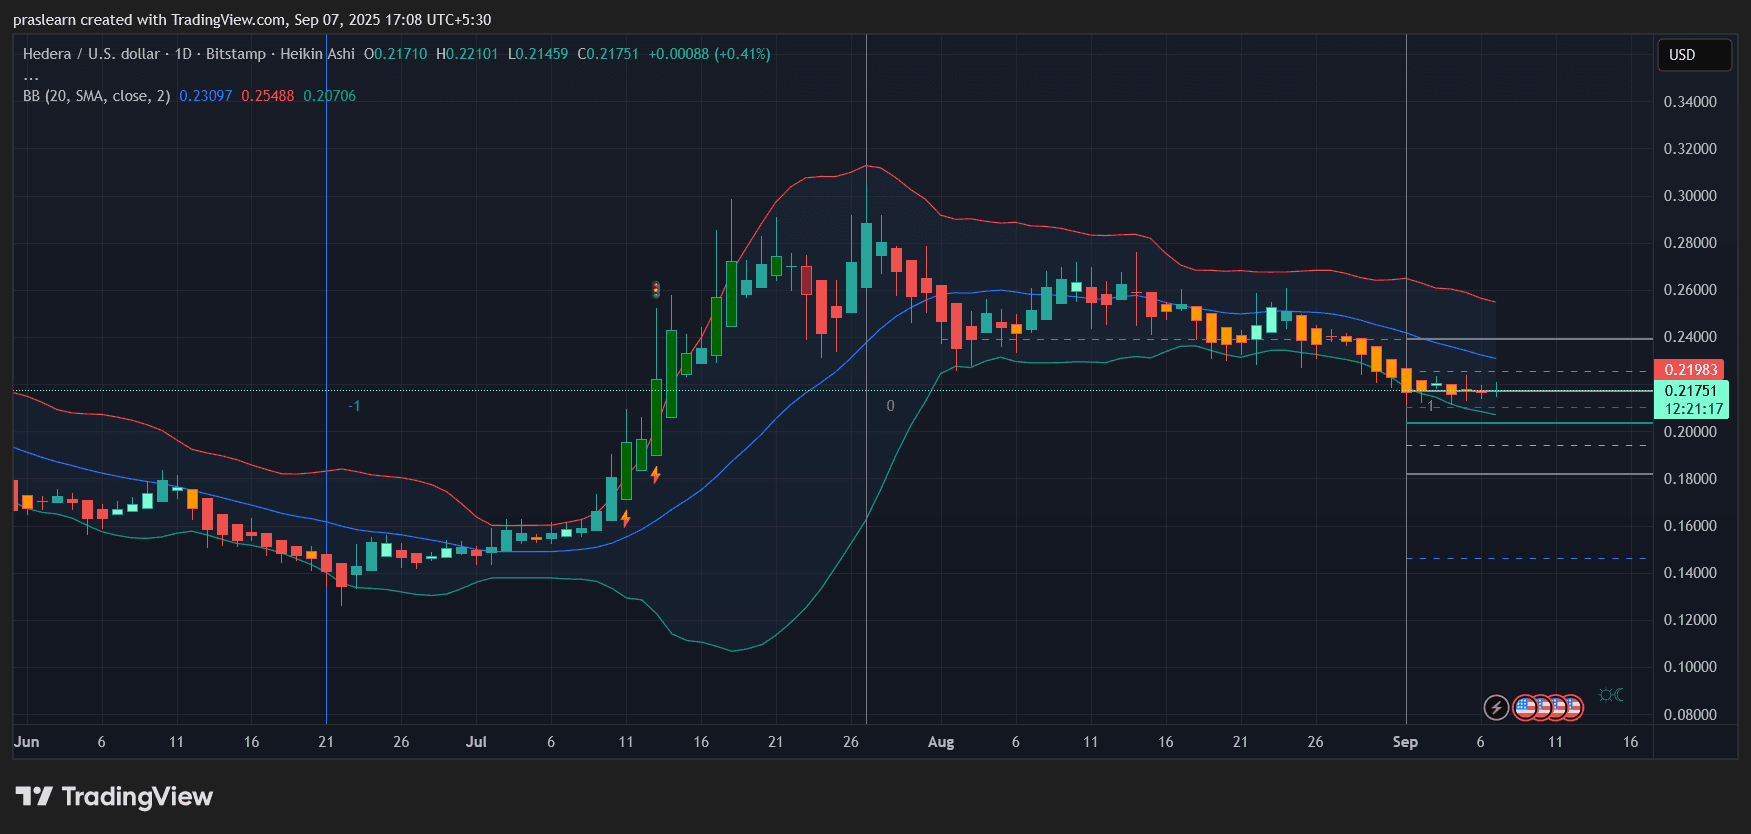 HBAR/USD Daily Chart- TradingView
Looking at the daily chart, HBAR price has been sliding since late July after its summer rally. The price is currently at 0.217, clinging just above the lower Bollinger Band. Momentum is clearly bearish, with candles printing red in a consistent downtrend. The middle band around 0.23 acts as immediate resistance, while the upper band near 0.25 marks the next ceiling.
Support zones stand out around 0.20 and 0.18. A break below 0.20 would open risk toward the mid-0.10s, but holding above 0.21 keeps the door open for a base-building phase. If ETF hype builds closer to November, we could see an explosive move once resistance near 0.24 is cleared.
Volatility Compression Signals a Bigger Move Ahead
The Bollinger Bands have narrowed compared to the July rally, a classic sign of volatility compression. This usually precedes a breakout move. Given the HBAR ETF news, the probability leans toward an upside breakout, but the timing is uncertain. Short-term traders should watch for a decisive daily close above 0.23, which would confirm that buyers are regaining control.
What Happens If HBAR ETF Approval Comes?
If the SEC gives the green light in November, HBAR price could quickly re-rate to new levels. Institutional inflows combined with FOMO from retail could push the token toward its July highs near 0.28 and potentially retest 0.30+. With supply locked in staking and governance, liquidity shocks are likely to magnify any demand surge. On the other hand, a rejection or delay would likely send Hedera price back into the 0.15–0.18 range.
Accumulation Window Before the Catalyst
$HBAR sits at a critical juncture. The HBAR ETF timeline provides a medium-term bullish driver, but the chart still leans bearish in the short run. Traders should watch for accumulation near 0.20–0.21, where risk-reward looks attractive ahead of November. A breakout above 0.23 would confirm upside momentum, while a breakdown below 0.20 would delay the bull case.
In short: Hedera price is in a quiet accumulation zone now, but once November approaches, the HBAR ETF decision could flip the switch into full-scale price discovery.
Disclaimer: The content of this article solely reflects the author's opinion and does not represent the platform in any capacity. This article is not intended to serve as a reference for making investment decisions.
You may also like
The script at the end of 2018: The Federal Reserve continued to raise interest rates, US stocks plunged 20% from the September highs, forcing the Federal Reserve to "pivot" in January.
Goldman Sachs' head of trading believes the current US stock market is repeating the scenario of late 2018, with monetary tightening and equity market pressure. The Goldman Sachs Financial Conditions Index has tightened by about 8 points in two weeks, reaching the highest level in a year. The selloff has broadened from tech stocks to defensive sectors. Gold and equities are declining simultaneously, possibly indicating investors are selling assets to raise cash, making gold a key indicator for observing liquidity stress.

Goldman Sachs Trader “Revisits the 2018 Playbook”: Still Clearly Remembers “On December 24th, Clients Asked Why the Market Dropped So Much—And I Had No Idea”
Brian Garrett pointed out that the current adjustment in the US stock market is similar to the sharp decline in Q4 2018: the S&P 500 has already experienced 42% of the corresponding drop, and the VIX is approaching its peak just before Christmas. If history repeats itself, the bottom of this cycle may appear in January next year. However, the credit market and Federal Reserve policy have yet to provide clear signals of a bottom.
Anthropic (ANT.US) nearly “broke issue price,” but Claude knocks on the doors of “the highest peak in mathematics”! 17 million lines of Lean code used to write a candidate proof for the Riemann Hypothesis
On November 20th, Eastern Time, on its second day of trading, Anthropic's intraday price dropped to a low of $83.05, just 5 cents above the offering price of $83, and finally closed at $88.91, a decline of 8.50%. On the same day, the company's mathematician Levant Alperg announced on his personal website that he and Claude had found a candidate proof for the Riemann hypothesis, which has puzzled the mathematics community for 167 years, and released about 17 million lines of Lean formalized code.

As US stocks plummet, the parent company of GTA 6 rises against the market! First-day sales hit a record $3.79 billion; Wall Street shifts focus to next-generation GTA Online.
According to Rentrak data, the global box office of "Grand Theft Auto VI" has also surpassed that of "Avengers: Endgame," the highest-grossing film of all time, which has a global box office of approximately $2.94 billion.

Crypto prices
More


