
BTC Data Reveals September as the Toughest Trading Month


- September shows the lowest returns, with only 39 percent of closes finishing positive.
- Coinglass data shows Q4 often delivers stronger gains after weaker summer months.
- Analysts confirm that September remains to be the most difficult month for Bitcoin.
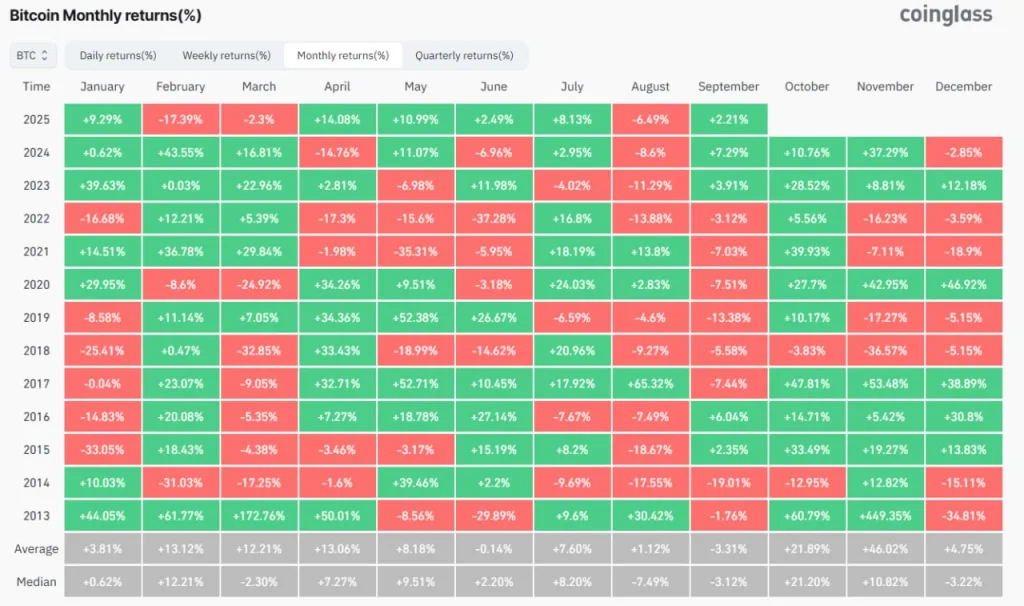
Bitcoin’s September performance data from Coinglass shows sharp volatility, with results alternating between strong gains and heavy losses across different years. The month has repeatedly produced uneven outcomes that continue to attract investor attention.
In 2024, Bitcoin saw an increase of 7.29% in September after recovering from an 8.6% drop in August. The previous year gave a smaller rise of 3.91%, while 2022 observed a drop of 3.12%, following deeper losses earlier.
The pattern extends back to 2021, when Sep closed at a loss of 7.03 percent, despite hefty gains in earlier months. In 2020, September closed at -7.51%, but it witnessed recoveries in October and November.
Source: Coinglass
Historical Performance Patterns
The data also reveals dramatic extremes. In 2017, September surged by 65.32%, which is the highest monthly return on record for that period. By contrast, 2019 ended with a –13.38% fall, while 2014 posted a steeper –19.01% decline. Coinglass records place the average September return at –3.31%, with a median of –3.12%, showing the month’s history of volatility.
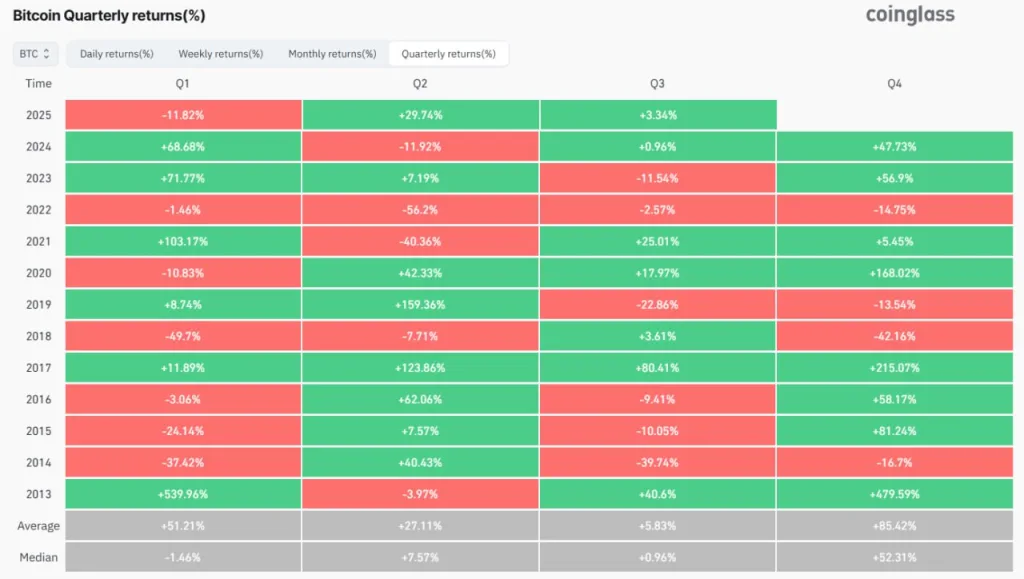
Quarterly returns offer further insight. In 2025, Bitcoin dipped 11.82% in Q1 before bouncing up by 29.74% in Q2 and 3.34% in Q3. 2024 started more positively with a 68.68% gain in Q1 but turned bearish with 11.92% lost in Q2 before going almost flat with 0.96% in Q3 and then taking a high at 47.73% in Q4.
Quarterly performance across key years
There is a sharp rise followed by corrections in the 2023 performance. Q1 made +71.77%, Q2 made +7.19%, but Q3 made -11.54%, and Q4 made +56.9%. Overall, in 2022, the performance was negative in all quarters, with values of -1.46%, -56.2%, -2.57% and -14.75% between Q1 and Q4.
Source: Coinglass
Earlier records depict the extremes. 2013 saw BTC rocket by +539.96% in Q1, followed up with +479.59% in Q4. On the other hand, 2018 showed the other side of the coin, with Q1 losing -49.79% and Q4 closing up at -42.16%. Other highs came in at Q4 2017 with +215.07% and at Q4 2020 with +168.02%.
The long-term averages support seasonality. Across years, Q1 has an average of +51.21%, Q2 has +27.11%, Q3 registers +5.83%, while Q4 leads at +85.42%. The median results reinforce Q4’s strength at +52.31%, suggesting that year-end periods usually tend to perform better.
Related: Corporate Bitcoin Treasuries Surpass 1 Million BTC, Led by Strategy
Analyst Perspective on Seasonality
Independent analysis by Crypto Patel on the X platform provides additional insight. Patel described September as Bitcoin’s “weakest month,” citing average returns of –2.8% over the past decade and noting that only 39% of September closes finished positive.
The combined data from Coinglass and Crypto Patel shows that Bitcoin’s September remains the most statistically challenging period. The looming question in investors mind would be if the recurring weakness could again precede a rally into the year’s end
The post BTC Data Reveals September as the Toughest Trading Month appeared first on Cryptotale.
Disclaimer: The content of this article solely reflects the author's opinion and does not represent the platform in any capacity. This article is not intended to serve as a reference for making investment decisions.
You may also like
Nasdaq evaporated over $4 trillion in a week! After the global stock market's "Black Friday," the market begins to anticipate an AI industry chain rebound after excessive declines.
The S&P 500 Index plunged by 3.70% on Friday to 6,910.39 points, falling for the seventh consecutive trading day. Alongside the Dow Jones Industrial Average, which dropped 1.93%, both indices pulled back more than 10% from their historic closing highs, confirming entry into a technical correction. The Nasdaq Composite Index fell 5.28%, erasing its gains for the year. The Nasdaq 100 Index dropped 5.61%, falling about 19.84% from its historic closing high on October 6. At one point during the session, the decline exceeded 20%, entering what is referred to as a "technical bear market area."
VIX surges to highest level since the tariff dispute in April last year; Goldman Sachs Fear Index approaches maximum; US stocks may face another $80 billion sell-off next week
As the U.S. stock market faced a sharp sell-off on Friday, two major Wall Street market risk indicators issued warnings simultaneously.
Nvidia (NVDA.US) plunges 46% over seven weeks, marking the longest losing streak since the 2008 financial crisis, with its market capitalization evaporating by $2.6 trillion.
Nvidia is experiencing its longest consecutive weekly decline since the 2008 global financial crisis.
Overnight U.S. Stocks | Stocks, Gold, and Bitcoin Plunge Indiscriminately as VIX Fear Index Surges to 40, Nasdaq Wipes Out Year-to-Date Gains
At the close, the Dow Jones Industrial Average fell 949.73 points, or 1.93%, to 48,147.32 points; the S&P 500 index dropped 265.44 points, or 3.70%, to 6,910.39 points; and the Nasdaq declined 1,261.46 points, or 5.28%, to 22,617.73 points, down 2.7% year-to-date.
Crypto prices
More


