Bitget App
Trade smarter
Buy cryptoMarketsTradeFuturesStocksEarnInstitutionAI & More
XRP To Soar Higher? Key Harmonic Pattern Signaling Potential Upside Move

XRP To Soar Higher? Key Harmonic Pattern Signaling Potential Upside Move

CoinsProbeCoinsProbe2025/08/19 22:15
By:Nilesh Hembade

Date: Mon, Aug 18, 2025 | 06:20 PM GMT

The cryptocurrency market is experiencing mild selling pressure as Ethereum (ETH) slips 4% on the day, pulling back to $4,350 from its recent high of $4,780. This dip has spilled over into the major altcoins with XRP also trading lower.

Currently, XRP is down around 4% on the week, but beneath the surface, a well-recognized harmonic pattern is forming on the charts—one that could signal a potential upside move in the days ahead.

XRP To Soar Higher? Key Harmonic Pattern Signaling Potential Upside Move image 0 Source: Coinmarketcap

Harmonic Pattern Hints at Potential Upside

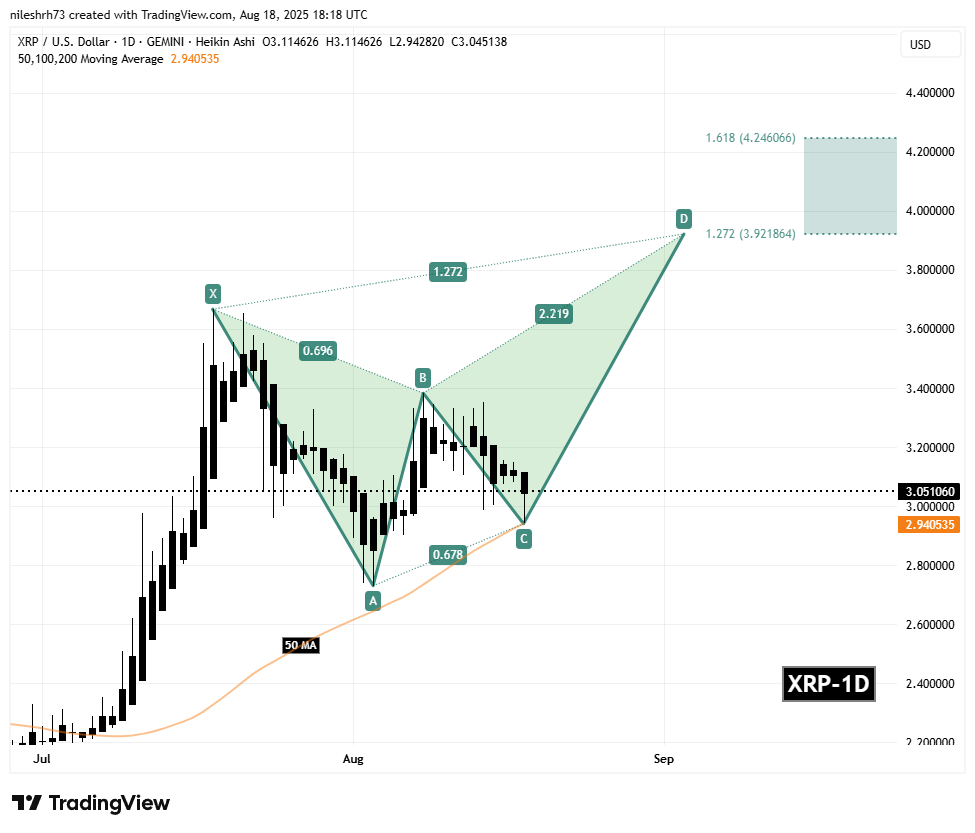
On the daily chart, XRP is shaping up within a Bearish Butterfly harmonic pattern. Despite the “bearish” label, this setup often precedes bullish continuations during its final leg (CD), when price extends into the Potential Reversal Zone (PRZ).

The formation began at point X ($3.66), followed by a dip to A, a rebound to B, and another correction to C near $2.94. From that point, XRP has started to recover, now trading around $3.05.
XRP To Soar Higher? Key Harmonic Pattern Signaling Potential Upside Move image 1 XRP Daily Chart/Coinsprobe (Source: Tradingview)

Importantly, the token has defended its 50-day moving average (MA) at $2.94, which is acting as a short-term support zone. Holding above this level strengthens the bullish case for XRP’s next leg higher.

What’s Next for XRP?

If buyers maintain control above the 50-day MA and point C support ($2.94), XRP could advance toward the PRZ, which stretches from $3.92 (1.272 Fibonacci extension) to $4.26 (1.618 Fibonacci extension). Historically, these levels serve as key completion targets for the Butterfly pattern, often marking areas where momentum either consolidates or reverses.

On the downside, a failure to sustain above $2.94 would weaken the harmonic structure, potentially delaying or invalidating the bullish breakout scenario.


0
0

Disclaimer: The content of this article solely reflects the author's opinion and does not represent the platform in any capacity. This article is not intended to serve as a reference for making investment decisions.

Understand the market, then trade.
Bitget offers one-stop trading for cryptocurrencies, stocks, and gold.
Trade now!

You may also like

Goldman Sachs: The Sell-off in US Tech Stocks May Be Nearing Its End, S&P 500 Aiming for 8,700 Points in the Next 12 Months

Goldman Sachs expects the S&P 500 index to rise to 8,700 points in the next 12 months. The bank believes that following the recent wave of sell-offs, stock valuations have declined, which should help the market continue to achieve positive returns even if corporate profit growth slows down.

智通财经•2026/11/16 01:56
Goldman Sachs: The Sell-off in US Tech Stocks May Be Nearing Its End, S&P 500 Aiming for 8,700 Points in the Next 12 Months

"Conservatively" Lowers 2028 Growth Rate but Maintains Overweight Rating—Morgan Stanley Interprets Nvidia in the "Post-Jensen Huang Era"

Jensen Huang resigned as CEO of Nvidia. Morgan Stanley has characterized this as a "major setback," lowering its forecast for data center revenue growth in fiscal 2028 by 10%, but maintaining an "Overweight" rating. The firm believes that Nvidia's supply chain and product pipeline are secured for the next two years, that concerns over the CUDA barrier are exaggerated, and the company will continue to hold over 80% market share—the real variable lies in the uncertainty brought by the "interim CEO."

华尔街见闻•2026/11/16 01:31
"Conservatively" Lowers 2028 Growth Rate but Maintains Overweight Rating—Morgan Stanley Interprets Nvidia in the "Post-Jensen Huang Era"