
Bitcoin Prepares For Make-Or-Break Move As Textbook Triangle Meets Tight Range

Bitcoin is approaching a critical juncture as its textbook ascending triangle converges with a tight trading range. Consolidation near key support and resistance levels sets the stage for a potential breakout or breakdown, making the next moves crucial for market momentum.
Ascending Triangle Signals Strength
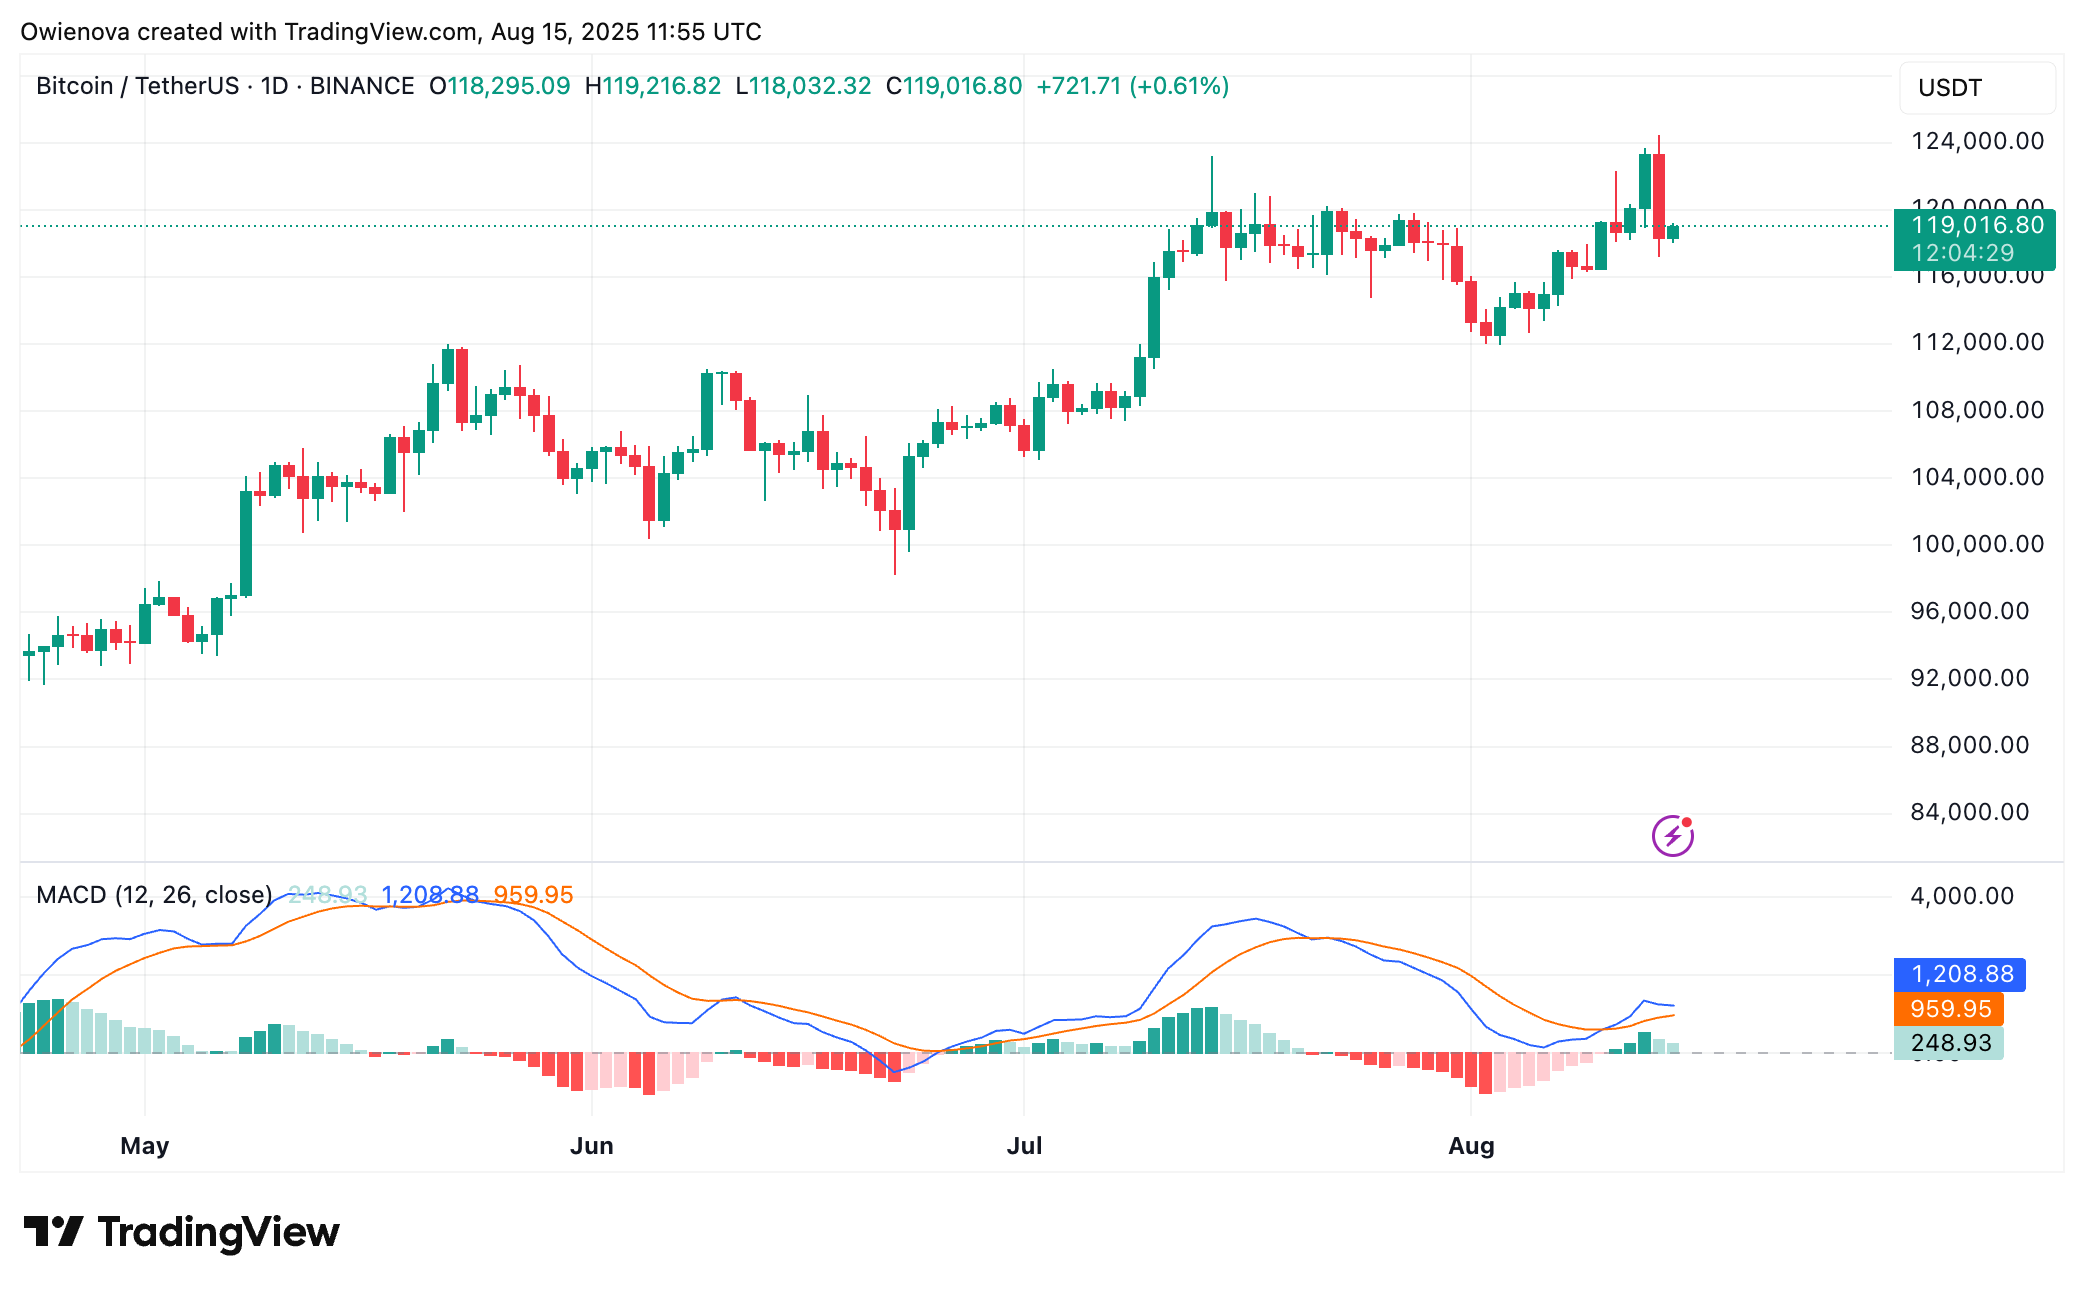
Alpha Crypto Signal, in a recent post, highlighted that Bitcoin is currently shaping a textbook ascending triangle pattern on the daily chart — a well-recognized bullish continuation setup. The analyst explained that price action is consolidating just under the horizontal resistance zone at $122,500, while a series of higher lows continues to form along the rising trendline, signaling strong underlying demand.
The analyst emphasized that as long as BTC holds above the 9 EMA at $118,738 and respects the ascending triangle’s support line, the overall bias remains bullish. These levels are crucial in maintaining the pattern’s structure, and a break below them could shift sentiment in favor of the bears. The persistence of higher lows indicates that buyers are consistently stepping in, preventing significant pullbacks, as indicated on the chart.

In conclusion, Alpha Crypto Signal stated that a clean break above the $122,500 resistance, backed by strong volume, could open the door for BTC to push toward a new all-time high. Such a move is likely to confirm the ascending triangle breakout and potentially trigger the next major bullish wave in the market.
Bitcoin Stuck Between $112,592 And $123,334
In an X post, X_Crypto, after examining Bitcoin’s action in a 4-hour timeframe, revealed that the flagship asset is currently trading within a defined range between $112,592 and $123,334, as highlighted on the chart. Meanwhile, the price is hovering around $119,106, with local support at $117,445 and the nearest resistance set at $123,334.
The analyst noted that above the current range, $124,576 stands out as a key resistance zone. If this level is breached, the next upside target would be $127,272, which could serve as a profit-taking point in a bullish scenario. These levels will be critical in determining the strength of any upward continuation.
On the downside, X_Crypto pointed out that a break below $117,445 could open the way for a drop toward $112,592 — the lower boundary of the range and a strong support zone where buyers are likely to step in. This area, the writer stressed, will be pivotal for defending the broader bullish structure.
Lastly, indicators on the lower timeframes, as mentioned by X_Crypto, are showing local oversold conditions, hinting at a potential short-term bounce. However, the analyst cautioned that without sustained consolidation above $119,106, selling pressure could persist, limiting any meaningful upside momentum.
Disclaimer: The content of this article solely reflects the author's opinion and does not represent the platform in any capacity. This article is not intended to serve as a reference for making investment decisions.
You may also like
Nvidia (NVDA.US) all-hands meeting draws widespread attention! Who will decide on "the next CUDA"? The test of the "post-Jensen Huang era" has only just begun.
One of the highlights of Nvidia's all-hands meeting is who will make decisions for the next-generation computing platform after Jensen Huang steps down, especially when market demand has not yet been validated, and who will be capable of coordinating the company's resources to successfully execute it.
Gold falls below $3,800 as Fed rate hike odds rise, Goldman Sachs targets $5,600 by 2028
NZD/USD Price Forecast: Declines below 0.5500, bearish bias intact below 100-day SMA

Anthropic IPO may deal a heavy blow to Nvidia (NVDA.US) short sellers! Cramer issues a warning, Bezos discusses Jensen Huang's successor
Anthropic will be listed on Nasdaq tonight, and Nvidia, as both investor and supplier, is receiving attention. Cramer warns short sellers.
Crypto prices
More


