
Can 3 Bullish Metrics Spark One Big Pi Coin Price Move? The Charts Say Yes

Pi Coin price is flashing three connected bullish signals — a rising ADX, a bullish RSI divergence, and a strong chart pattern — but can it turn them into one big rally?
The Pi Coin price has been riding the broader market rally, climbing close to 15% in the last 7 days; a pace traders haven’t seen in over a month.
August has started with signs of strength, and now, three key technical indicators are pointing in the same bullish direction. When multiple signals line up, the odds of a strong move rise, but only if the follow-through comes.
Rising ADX Shows Pi Coin’s Trend Is Gaining Strength
The Average Directional Index (ADX) measures the strength of a trend, not whether it’s bullish or bearish. A low reading means the market is drifting lower; a rising reading shows momentum is building.
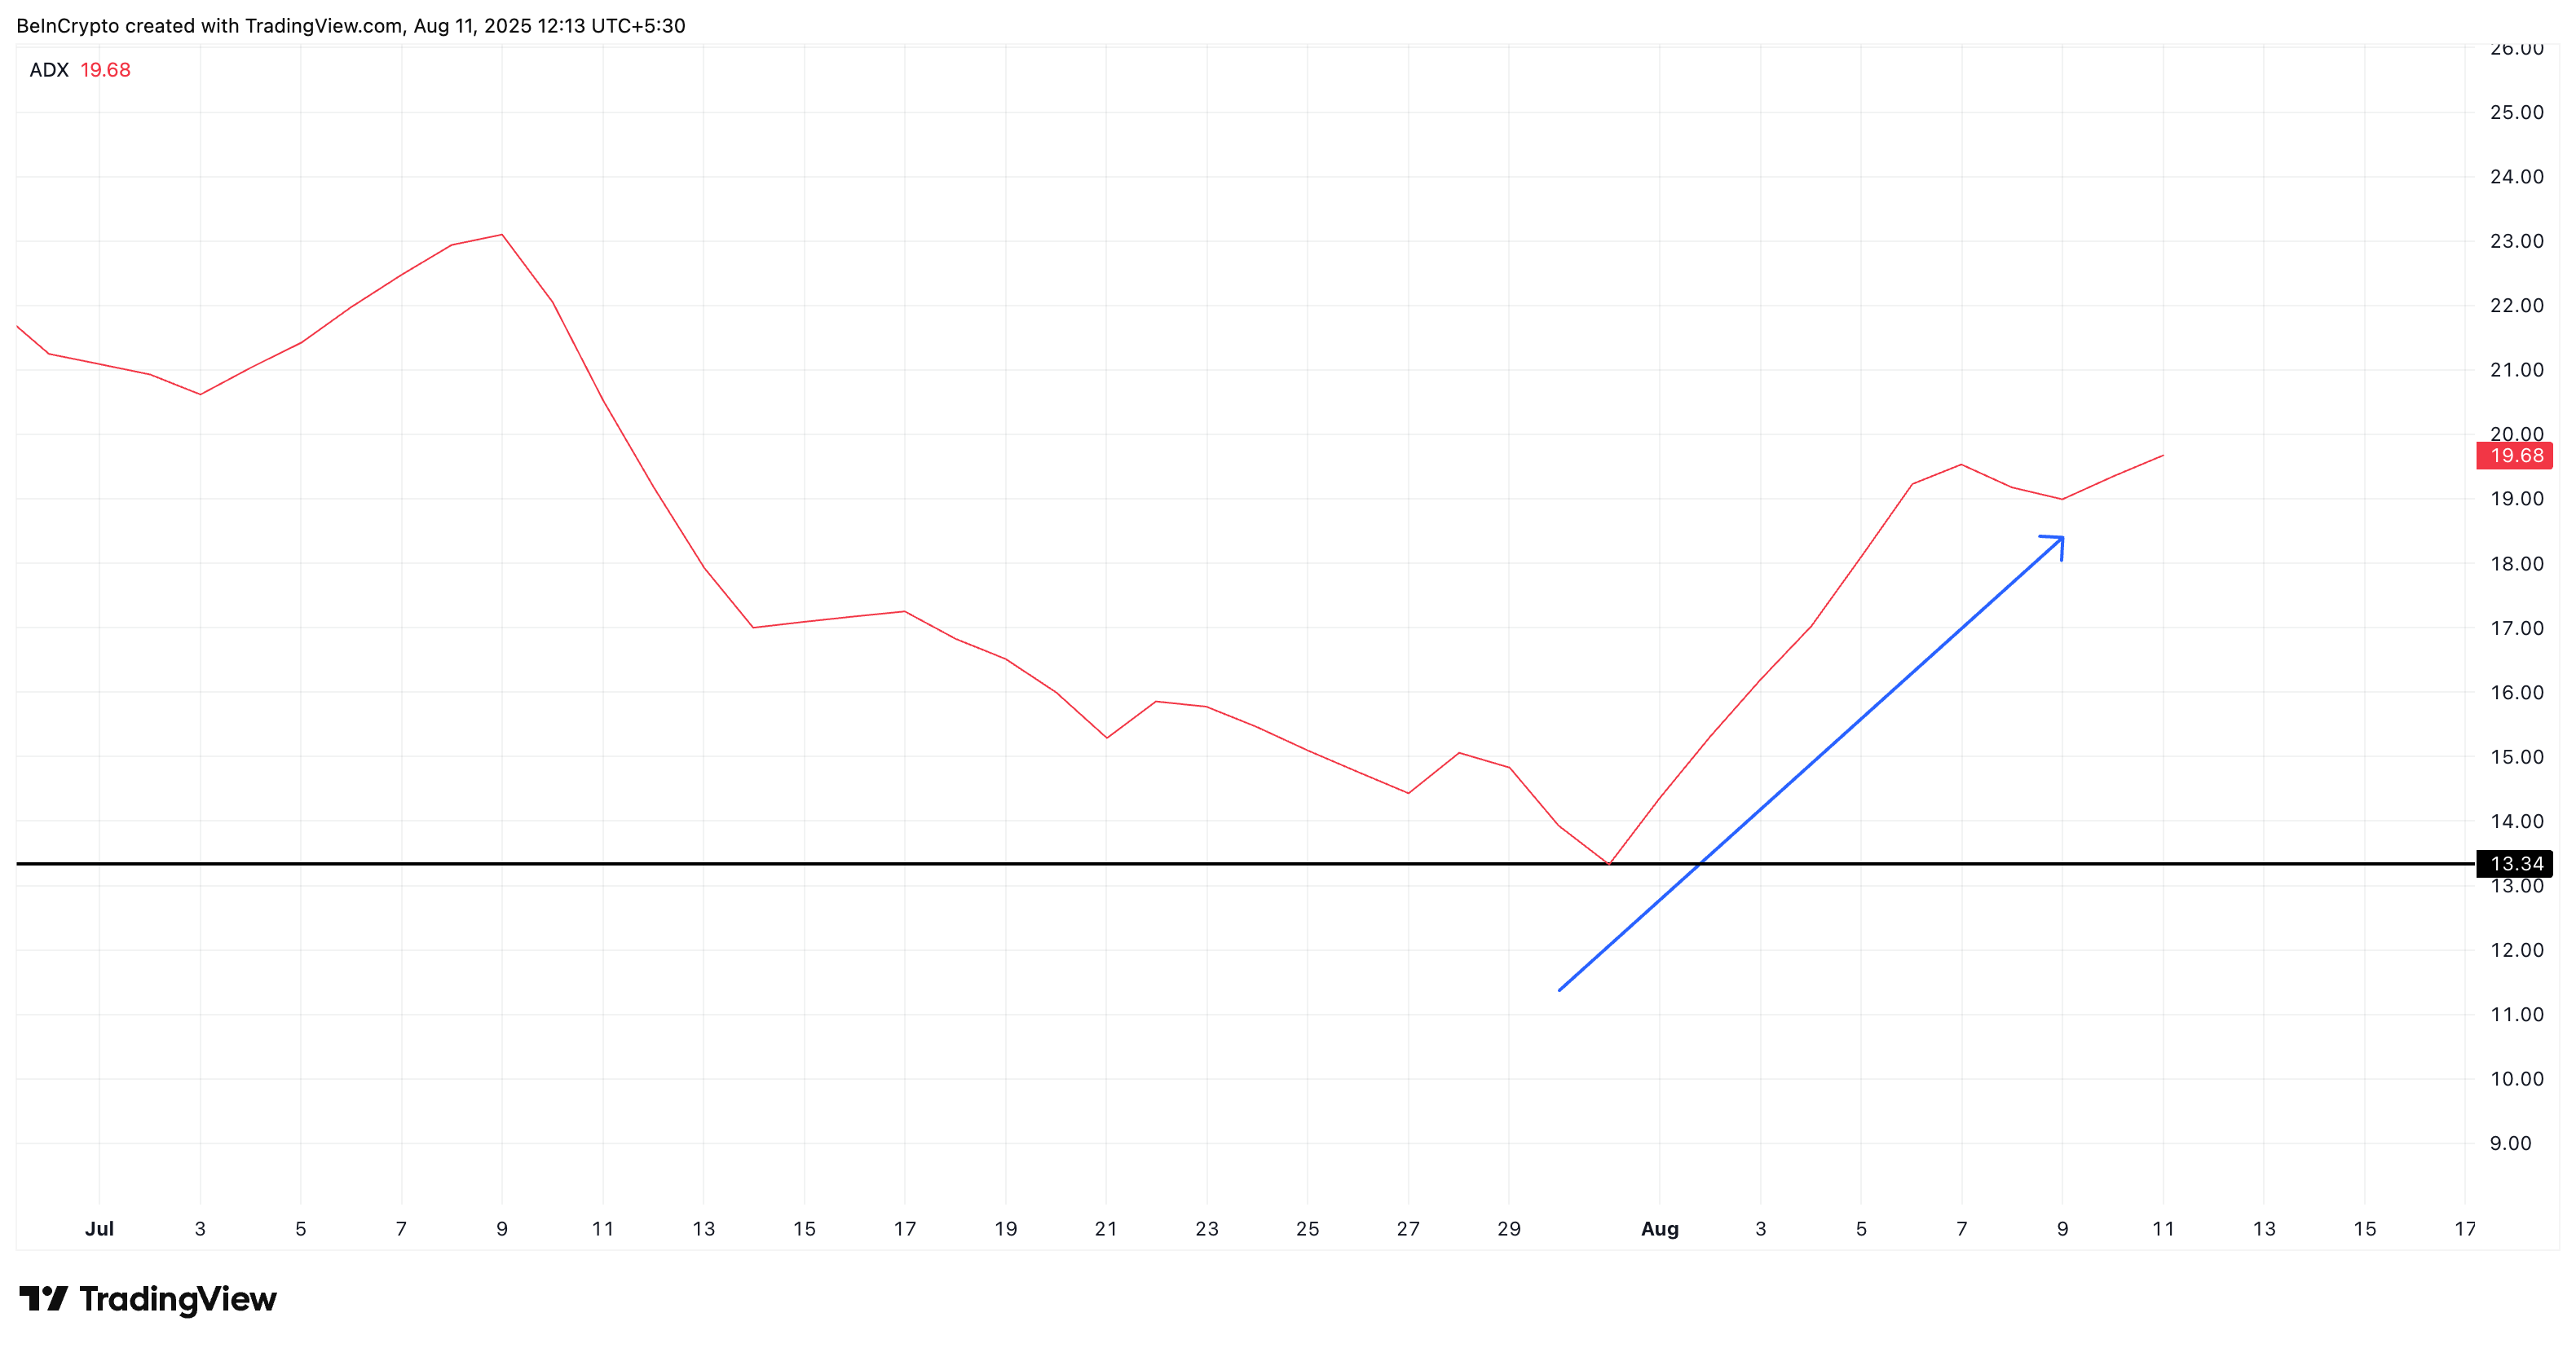 PI price and rising momentum:
TradingView
For the Pi Coin price, the ADX was near 13.3 on 31 July, which is considered a weak trend. As of now, it has jumped to 19.6, suggesting the current uptrend is starting to gain real traction.
A strengthening ADX in an upward price trend means buyers are pressing harder, and the market is committing more volume to the move. This makes Pi Coin’s next resistance tests more meaningful.
For token TA and market updates: Want more token insights like this? Sign up for Editor Harsh Notariya’s Daily Crypto Newsletter here.
Daily RSI Bullish Divergence Signals Buyers Are Quietly Building Pressure
The Relative Strength Index (RSI) measures whether an asset is overbought or oversold by tracking the speed and size of price changes. A bullish divergence occurs when price makes lower highs, but RSI makes higher highs, showing buying pressure is building even as price lags.
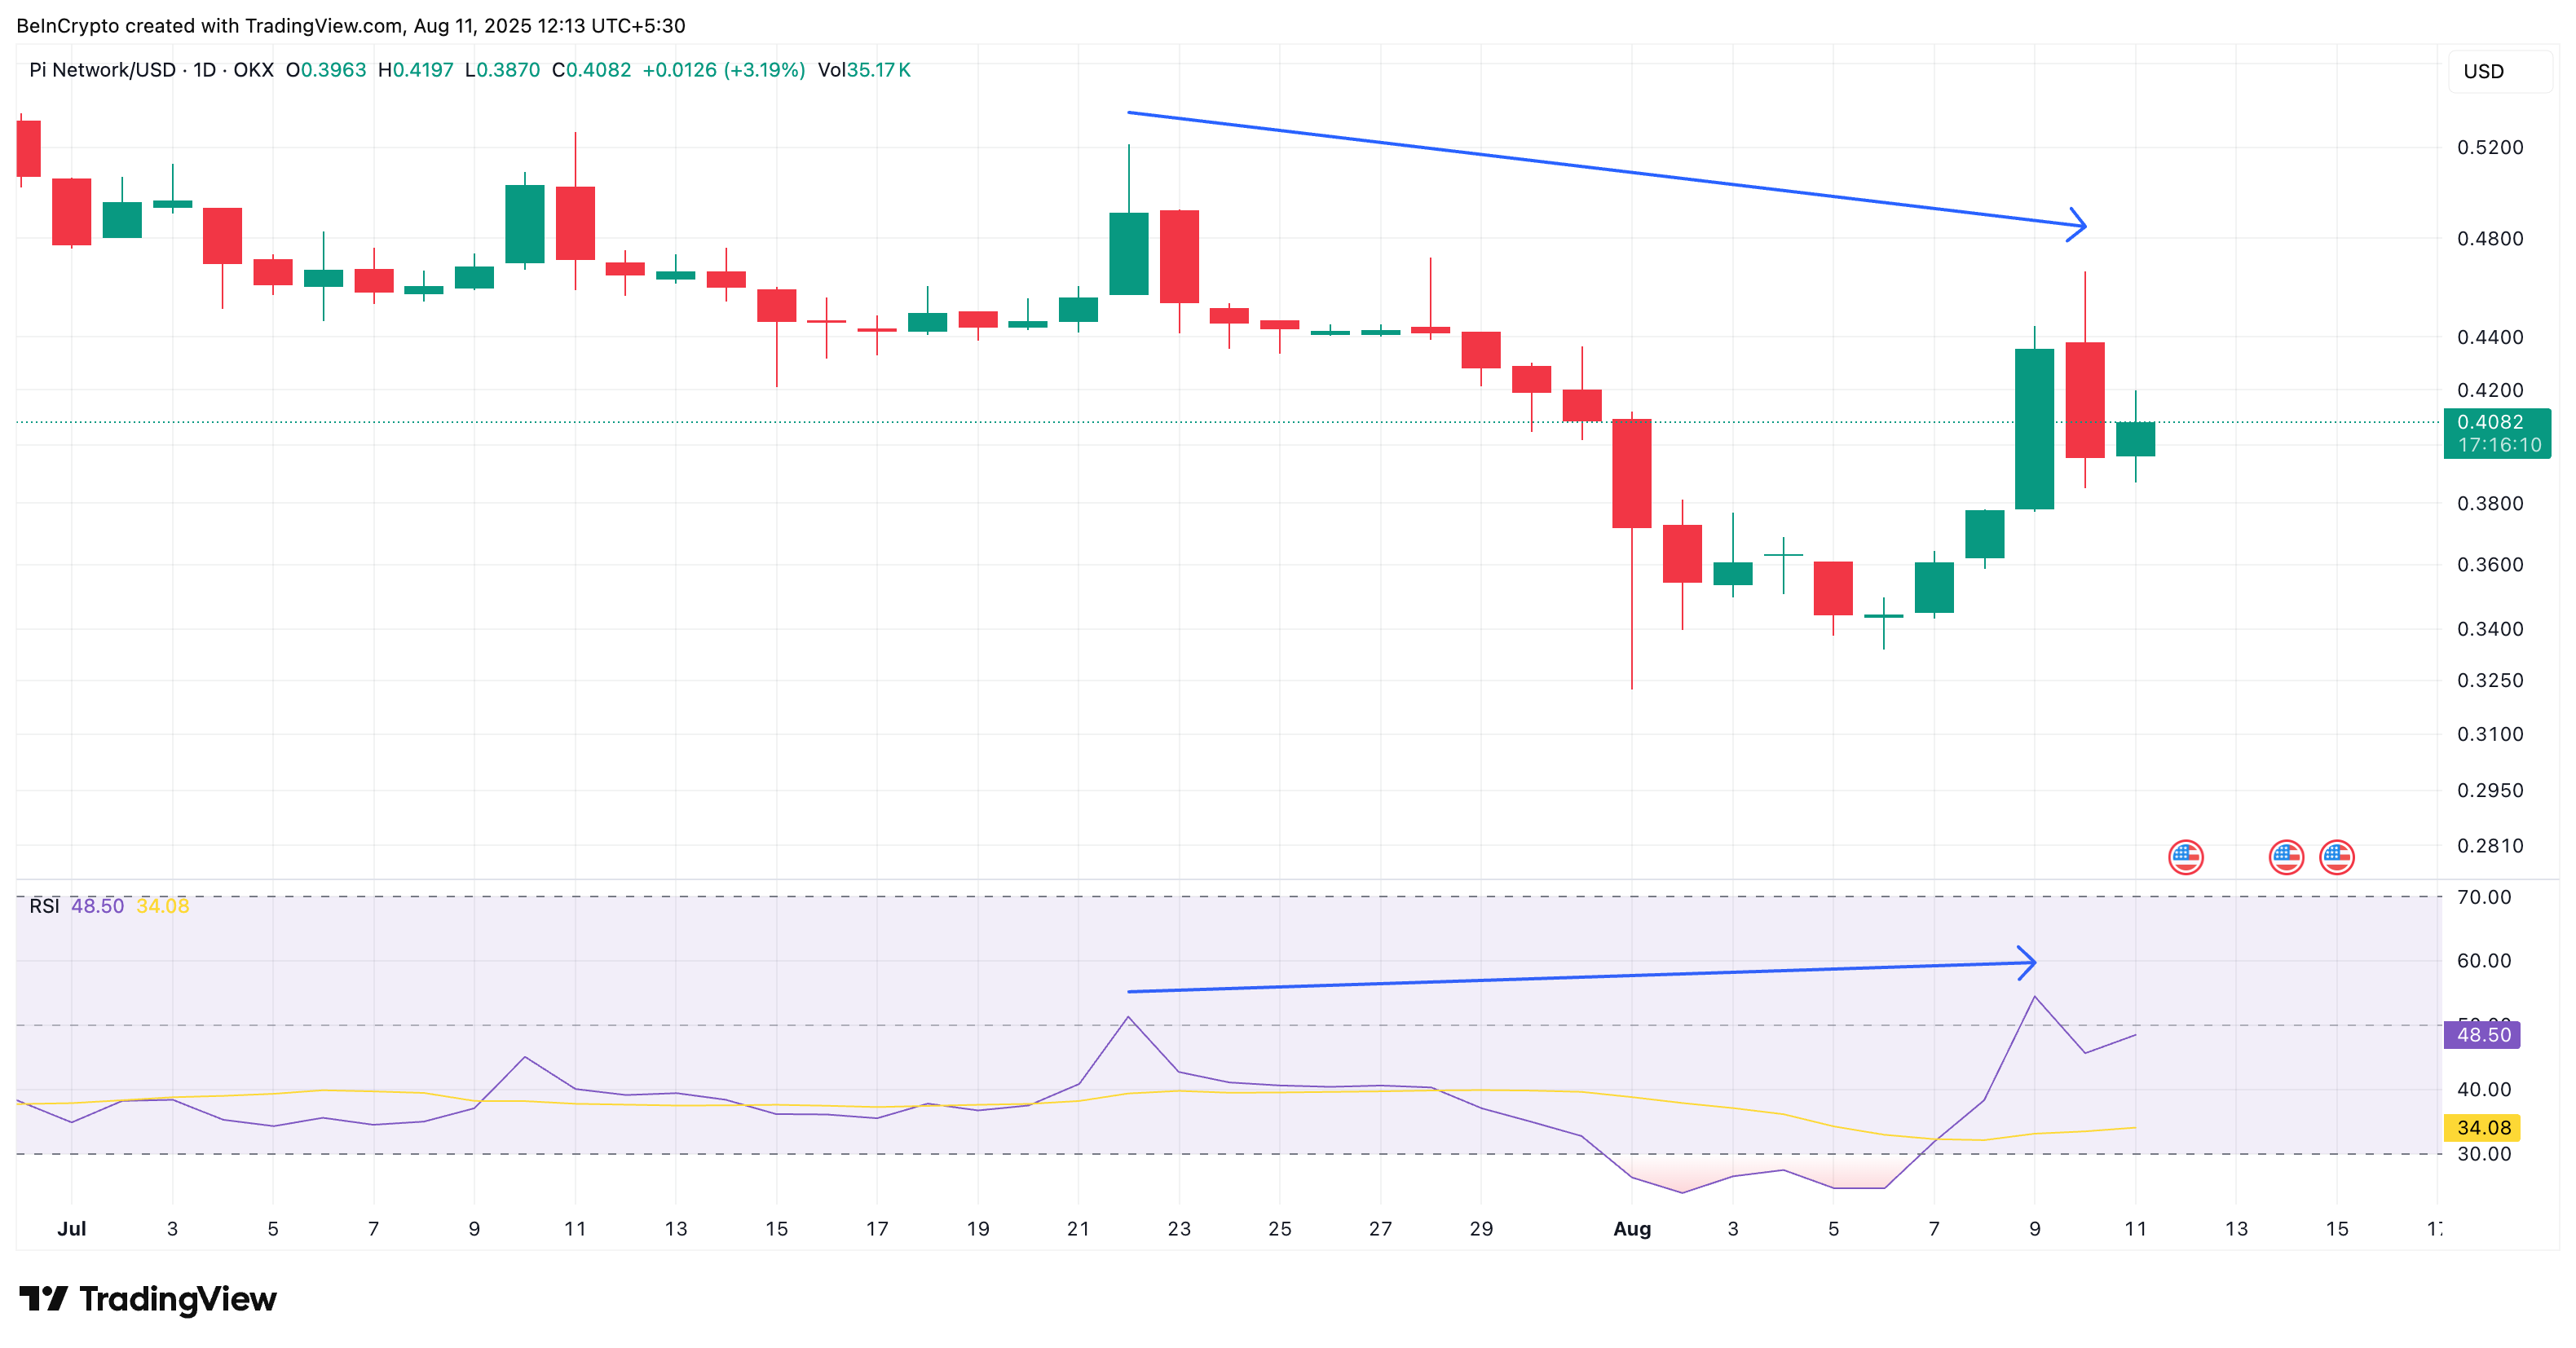 PI Coin price and bullish RSI divergence:
TradingView
For Pi Coin, on July 22, the price was around $0.52 with RSI at 51. By August 10, the price had dropped to $0.46, yet RSI climbed to 54. This mismatch shows that sellers are losing control, and buyers are slowly gaining ground. And this is our first bullish metric.
A rising ADX combined with a bullish RSI divergence means the uptrend isn’t just stronger and backed by improving momentum beneath the surface.
4-Hour Chart Keeps Pi Coin Price in a Bullish Structure
On the 4-hour chart, Pi Coin is holding inside an ascending triangle, a bullish continuation pattern, our second bullish metric. The PI Price remains above the 20-period exponential moving average (EMA) or the red line and 100-period EMA (sky blue), showing short- and mid-term trend strength.
But that’s not all. A bullish “Golden” crossover is almost there, with the 20-period EMA line closing in on the 100-period EMA line. While the lines have touched, all that remains is the crossover to happen. That’s the third bullish metric.
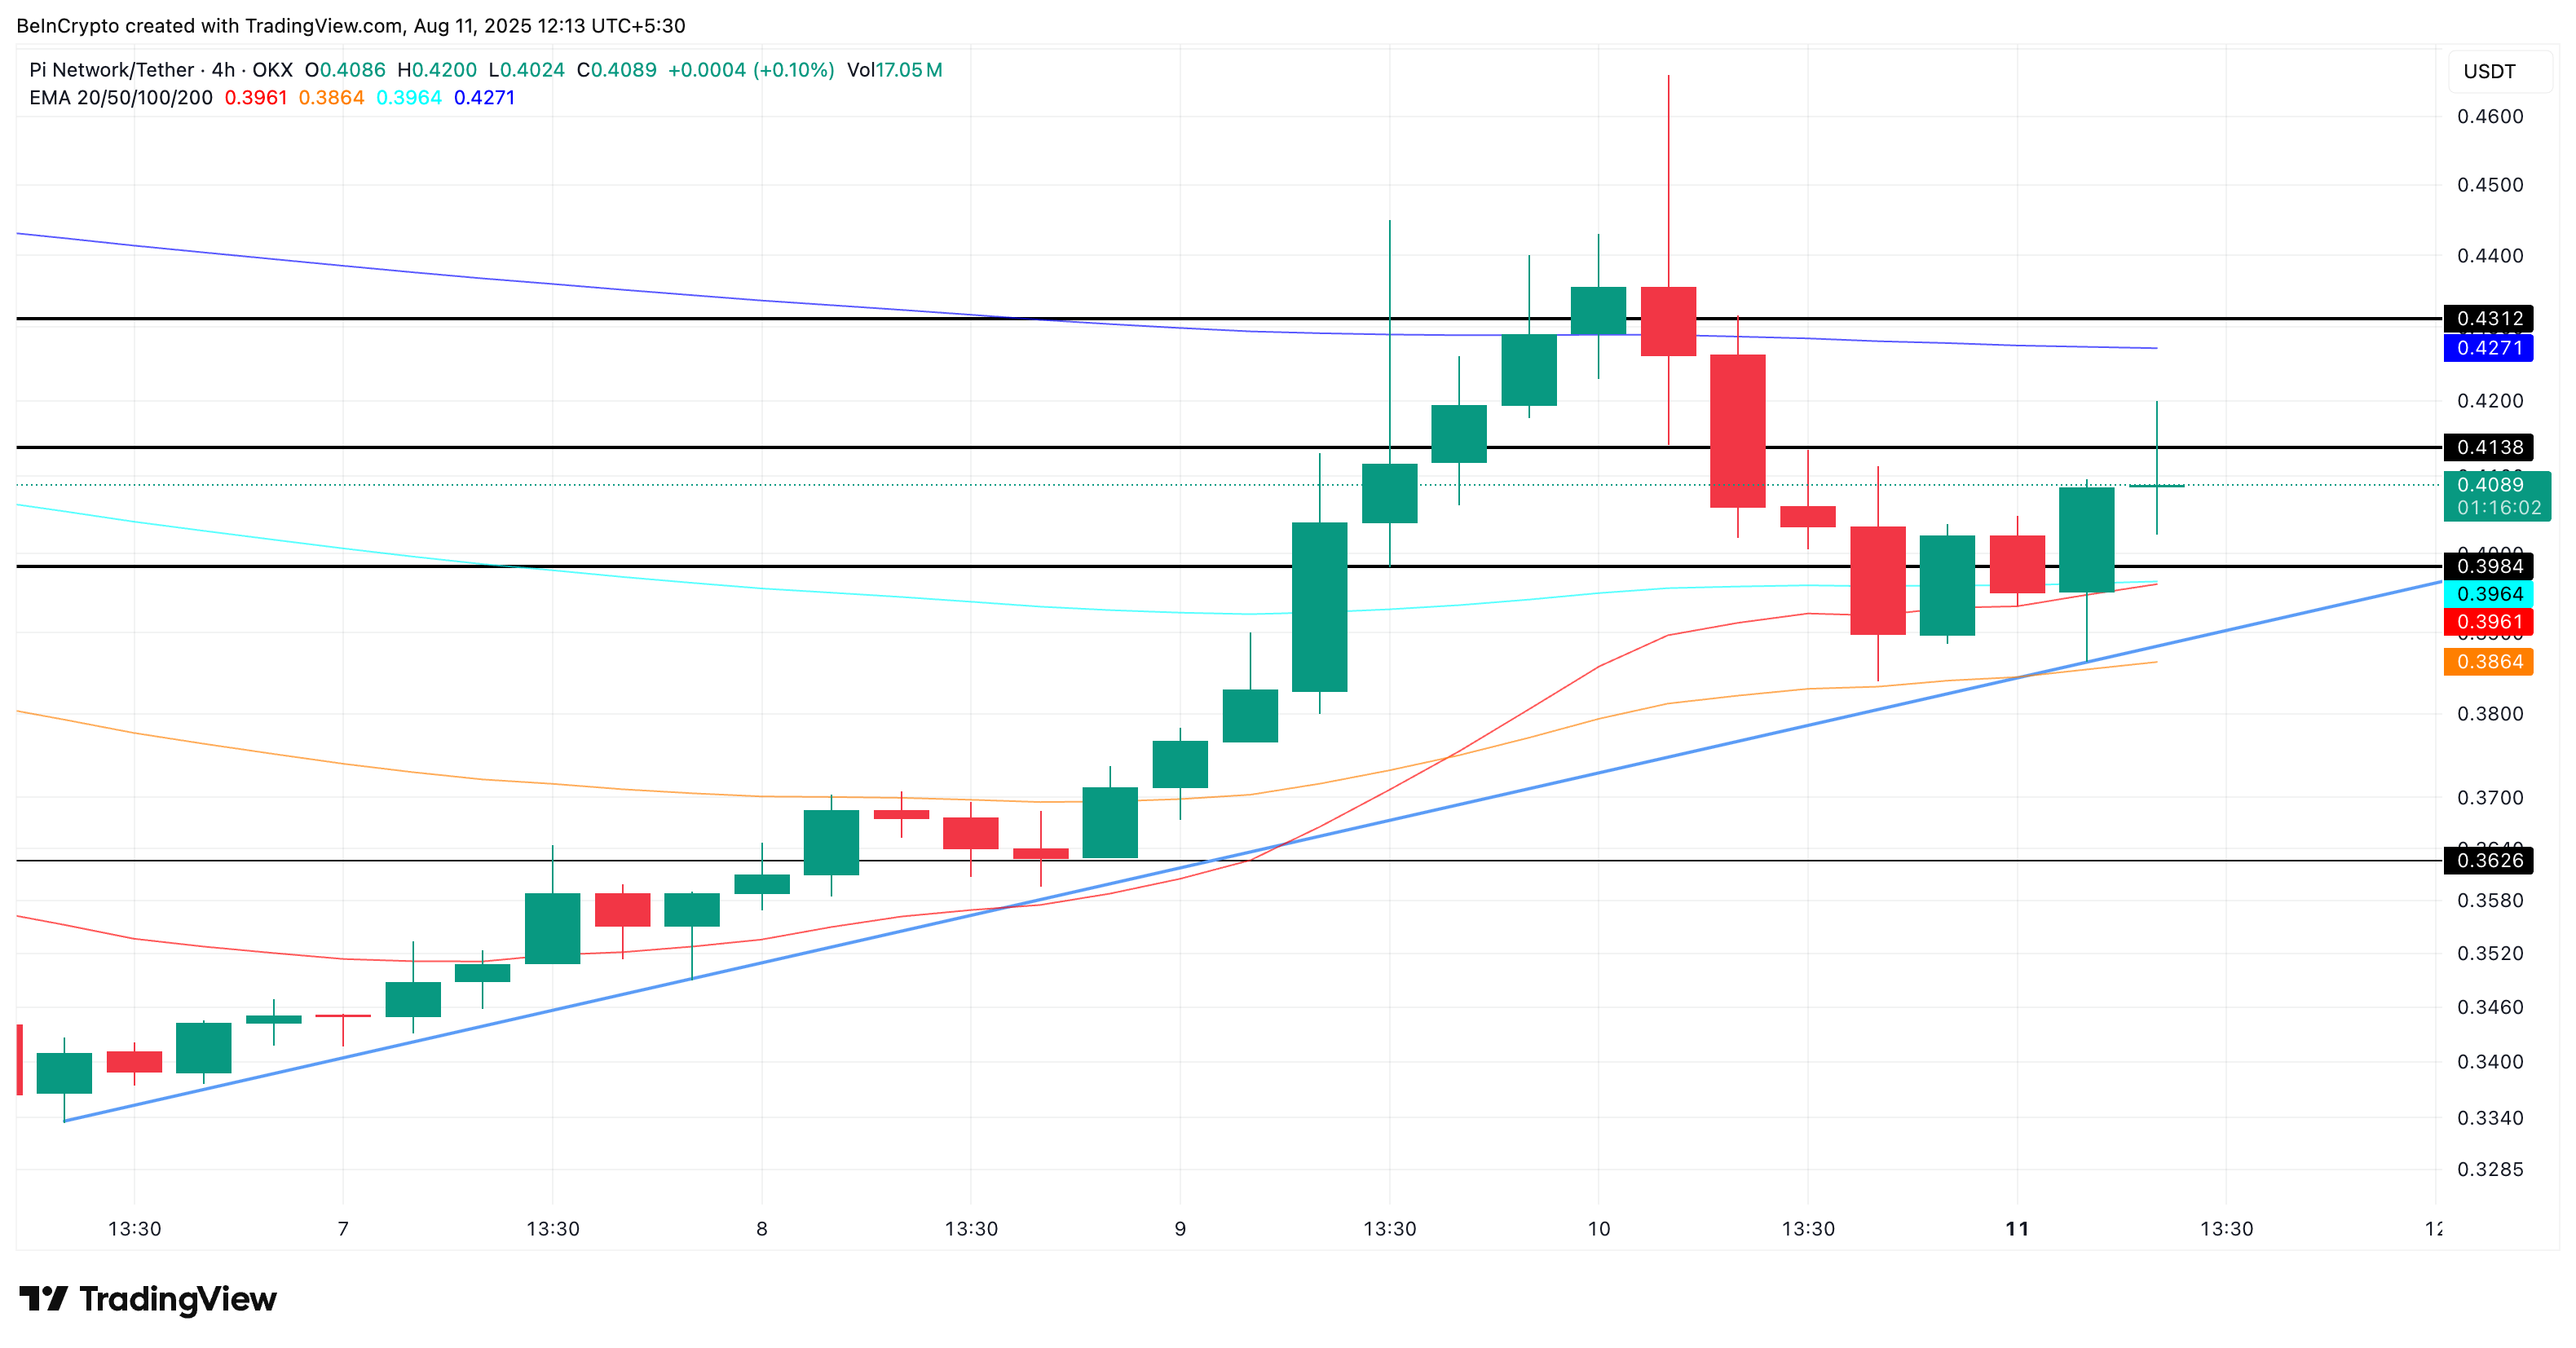 Pi Coin price analysis:
TradingView
Key elements from the chart to watch once the crossover lands:
- Upside breakout: A move above $0.41 and $0.43 could open the door for a sharper rally.
- Support: $0.39 is the first strong floor, followed by the 20-period EMA and 100-period EMA.
- Bearish flip: The structure turns short-term bearish only if the price falls below $0.38 (50 EMA).
If ADX keeps climbing and RSI holds its bullish divergence, a breakout from this pattern becomes more likely, and could fuel the “one big move” traders are watching for. However, a dip under $0.38 invalidates the bullish outlook.
Disclaimer: The content of this article solely reflects the author's opinion and does not represent the platform in any capacity. This article is not intended to serve as a reference for making investment decisions.
You may also like
Peter Brandt warns Bitcoin may never reclaim $126,000 all-time high after sharp drop

This Week's Market "Surprise": U.S. Treasury Yields and Tech Stocks Rise Together
Nomura strategist Matsuzawa believes that the U.S. stock market's tech rally is more of a technical correction, and the market has not rebuilt confidence in AI investments. Expectations for a Fed rate hike have surged, with the implied probability of a December hike reaching 111%. If dovish officials fail to correct overly hawkish expectations, financing pressures for tech companies will re-emerge, making it difficult for stocks and bonds to rise simultaneously.

Successfully recovered the Starship upper stage, SpaceX debuts “chopstick ship-clamp,” analyst: the most critical step supporting its trillion-dollar valuation
SpaceX has, for the first time, used the launch tower's mechanical arm to catch the Starship spacecraft mid-air, setting a precedent for orbital spacecraft recovery via tower mechanism in aerospace history. Bernstein analysts believe this is a key step supporting SpaceX's multitrillion-dollar valuation—full reusability will significantly reduce orbital costs, directly enhancing Starlink deployment efficiency and raising the commercial ceiling. Morgan Stanley warns that the market is underestimating the value of this mission, as it will significantly lower execution risks tied to commercial reuse and the expansion of AI-powered space computing capacity.

Solana falls 10%, $69 million in liquidations as ETF outflows weigh on price

Crypto prices
More


