Solana ($SOL) is currently trading at $181 after breaking out from a descending channel, with bullish indicators targeting a price of $187.
-
SOL breaks out from the descending channel, eyeing $187 with strong volume and bullish structure.
-
Large bid walls at $174 and derivatives surge point to sustained upward momentum for Solana.
-
RSI and MACD favor further gains as SOL holds above $173 support in bullish trend setup.
Solana ($SOL) is experiencing a bullish breakout, currently trading at $181 with targets set at $187 as market momentum builds.
Breakout Structure and Technical Levels
Chart analysis prepared by Ali Martinez shows SOL has broken out of a descending channel pattern after a bounce from the $155 support zone. This breakout is often associated with a shift toward buying pressure and has placed bulls in control of short-term market direction.
Solana $SOL is in the early stages of a bullish breakout, eyeing a move to $187! pic.twitter.com/Zg7JENEsGX
— Ali (@ali_charts) August 8, 2025
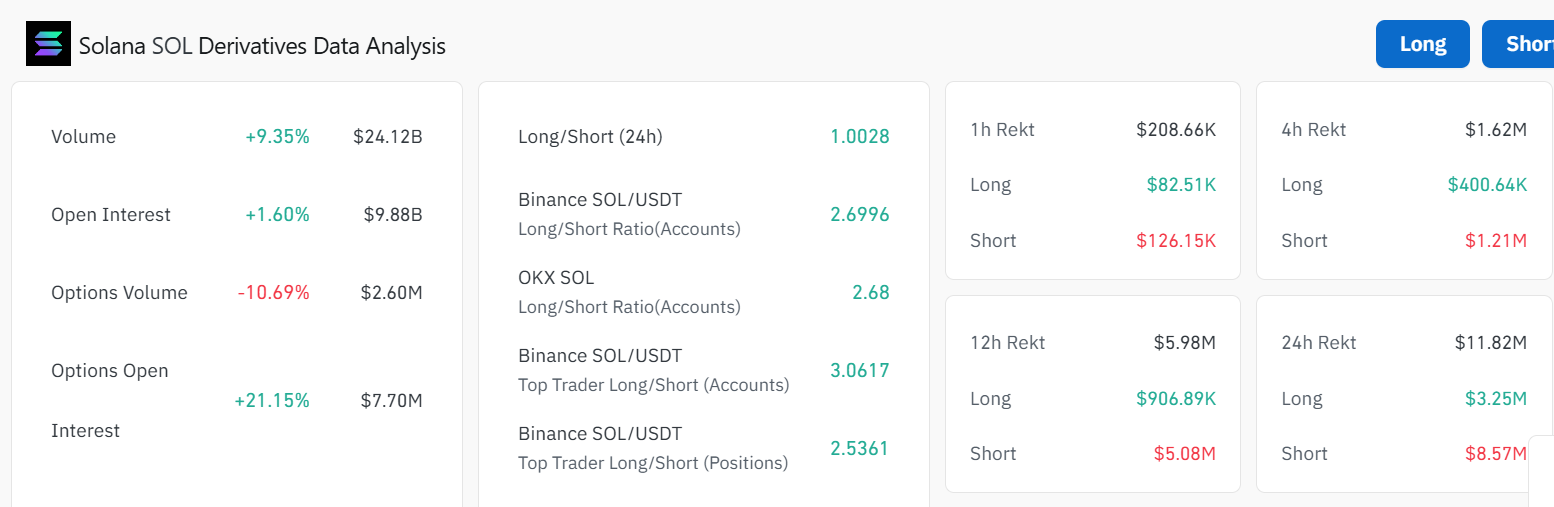
The chart data points toward a target of $187, which aligns with Fibonacci retracement levels and resistance points. Derivatives market figures from CoinGlass show a 9.35% increase in trades, with turnover volume reaching $24.12 billion.
 Source: CoinGlass
Open interest rose by 1.60% to $9.88 billion, indicating that more traders are positioning for further upward movement. Large bid walls near $174 suggest strong buy-side interest, with liquidity targets set at $177 and $194.
Market Momentum and Key Price Zones
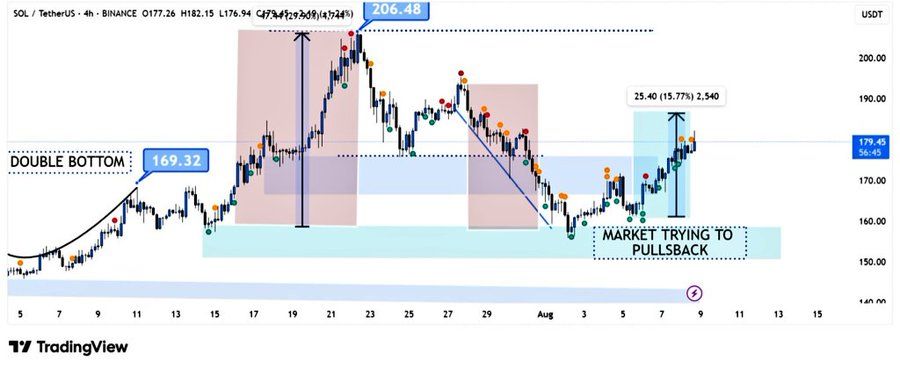
According to BitGuru, SOL on the 4-hour chart has risen 15.77% from the $155–$160 demand zone, breaking above $175. Price is now testing resistance near $180, and a sustained breakout could lead to a retest of the $206 high. Failure to break above could result in a pullback toward $170 or $165.
 Source: BitGuru(X)
Technical indicators remain supportive of further gains. RSI is at 60.61, which indicates bullish momentum but not being extremely overbought. The MACD line is above the signal line, suggesting continued upward pressure.
Price action also has the positive signs of the 50-day and 200 SMA that are on an increasing trend which supports the bullish structure. If SOL maintains its position above $173, market data suggests momentum could carry it toward the $187 target in the coming days, provided current buying activity remains consistent.
Key Takeaways
- Breakout Confirmation: SOL has broken out from a descending channel, indicating potential for further gains.
- Market Momentum: Rising volumes and open interest suggest strong buy-side interest.
- Price Targets: Key resistance levels are set at $187, with potential pullbacks to $170 or $165 if momentum falters.
Conclusion
In summary, Solana ($SOL) is currently experiencing a bullish breakout, trading at $181 with targets set at $187. The market momentum, supported by rising volumes and positive technical indicators, suggests that SOL may continue its upward trajectory in the coming days.