
Ethereum Price Prediction: Can BlackRock’s $103M Buy Push ETH to $4,000?

Ethereum Price Prediction: BlackRock Sparks Bullish Hopes for $4,000 ETH
Ethereum ($ETH) is back in the spotlight after reports surfaced that BlackRock—the world’s largest asset manager—has purchased $103 million worth of ETH. This news has reignited bullish sentiment across the crypto market, with traders eyeing the key $4,000 resistance level as the next big milestone.
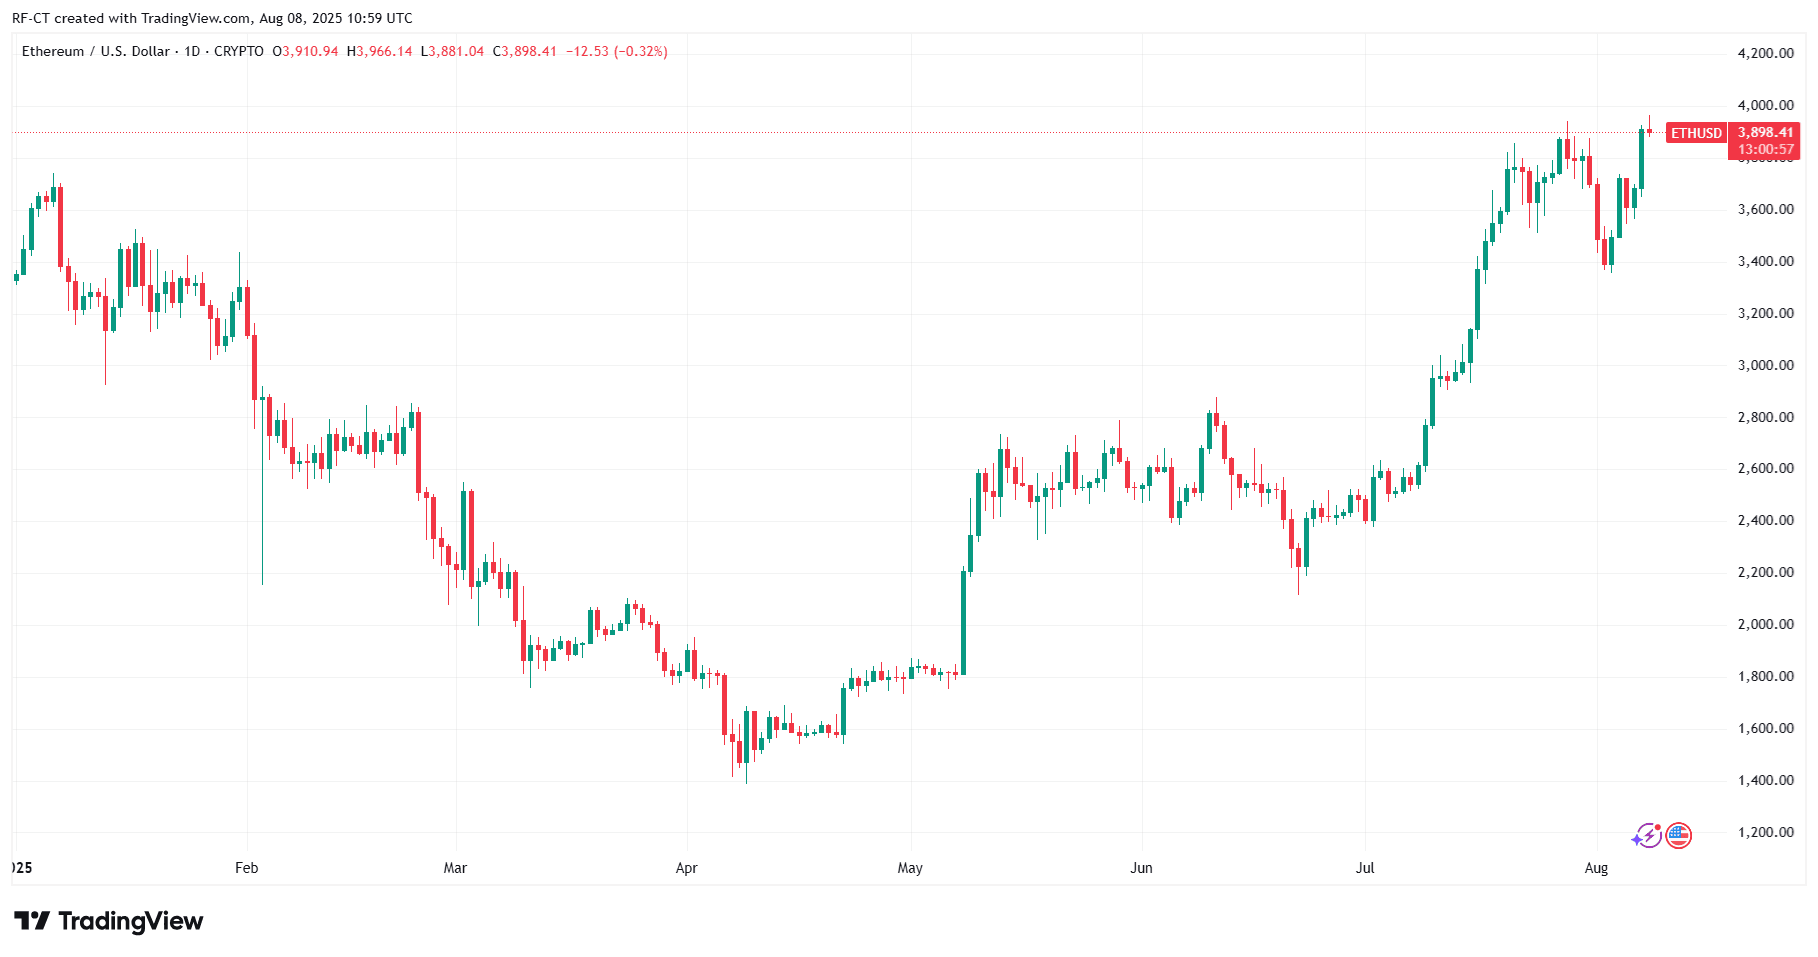 By TradingView - ETHUSD_2025-08-08 (YTD)
Ethereum Price Performance
At the time of writing, ETH is trading around $3,894, up slightly on the day. Over the past week, the token has held a tight range between $3,805 and $3,953, suggesting consolidation after a period of volatility .
- Immediate Resistance: $3,950–$4,000 (psychological and technical barrier)
- Key Support: $3,800, with stronger backing near $3,600 if selling pressure intensifies
BlackRock’s $103M Ethereum Purchase
According to market chatter, BlackRock’s move marks one of the most significant institutional Ethereum buys to date. While not yet officially confirmed through regulatory filings, the sheer scale of the purchase is enough to boost short-term sentiment.
- Institutional Confidence: BlackRock’s entry signals growing acceptance of Ethereum as an institutional-grade asset.
- Potential ETF Play: The timing aligns with increasing speculation about a U.S. spot Ethereum ETF launch later this year.
- Market Impact: Large-scale buys can shift market liquidity and encourage retail investors to follow suit.
Technical Analysis
- RSI (Relative Strength Index): Hovering near neutral, indicating ETH has room to move before hitting overbought territory.
- MACD: Close to a bullish crossover, suggesting upward momentum could strengthen if buying continues.
- Bollinger Bands: Price is near the upper band, pointing to possible short-term resistance before a breakout attempt.
If ETH breaks above $4,000 with strong volume, the next targets lie around $4,150–$4,250. Failure to do so could see the price retest support levels.
Fundamental Drivers Beyond BlackRock
- Ethereum Network Growth: Rising DeFi activity and NFT volumes continue to drive demand for ETH gas fees.
- On-Chain Metrics: Active addresses and staking participation remain healthy, showing steady user engagement.
- Macro Factors: U.S. Federal Reserve policy and broader risk-on sentiment in equities and crypto will play a role in ETH’s direction.
Ethereum Price Prediction
- Short-Term (1–2 weeks): If bullish momentum from the BlackRock news holds, ETH could challenge and break $4,000.
- Medium-Term (1–3 months): A confirmed breakout could push ETH toward $4,250–$4,500, especially if ETF approval rumors gain traction.
- Bearish Scenario: Failure to break $4,000 could see ETH drift back toward the $3,600 support zone.
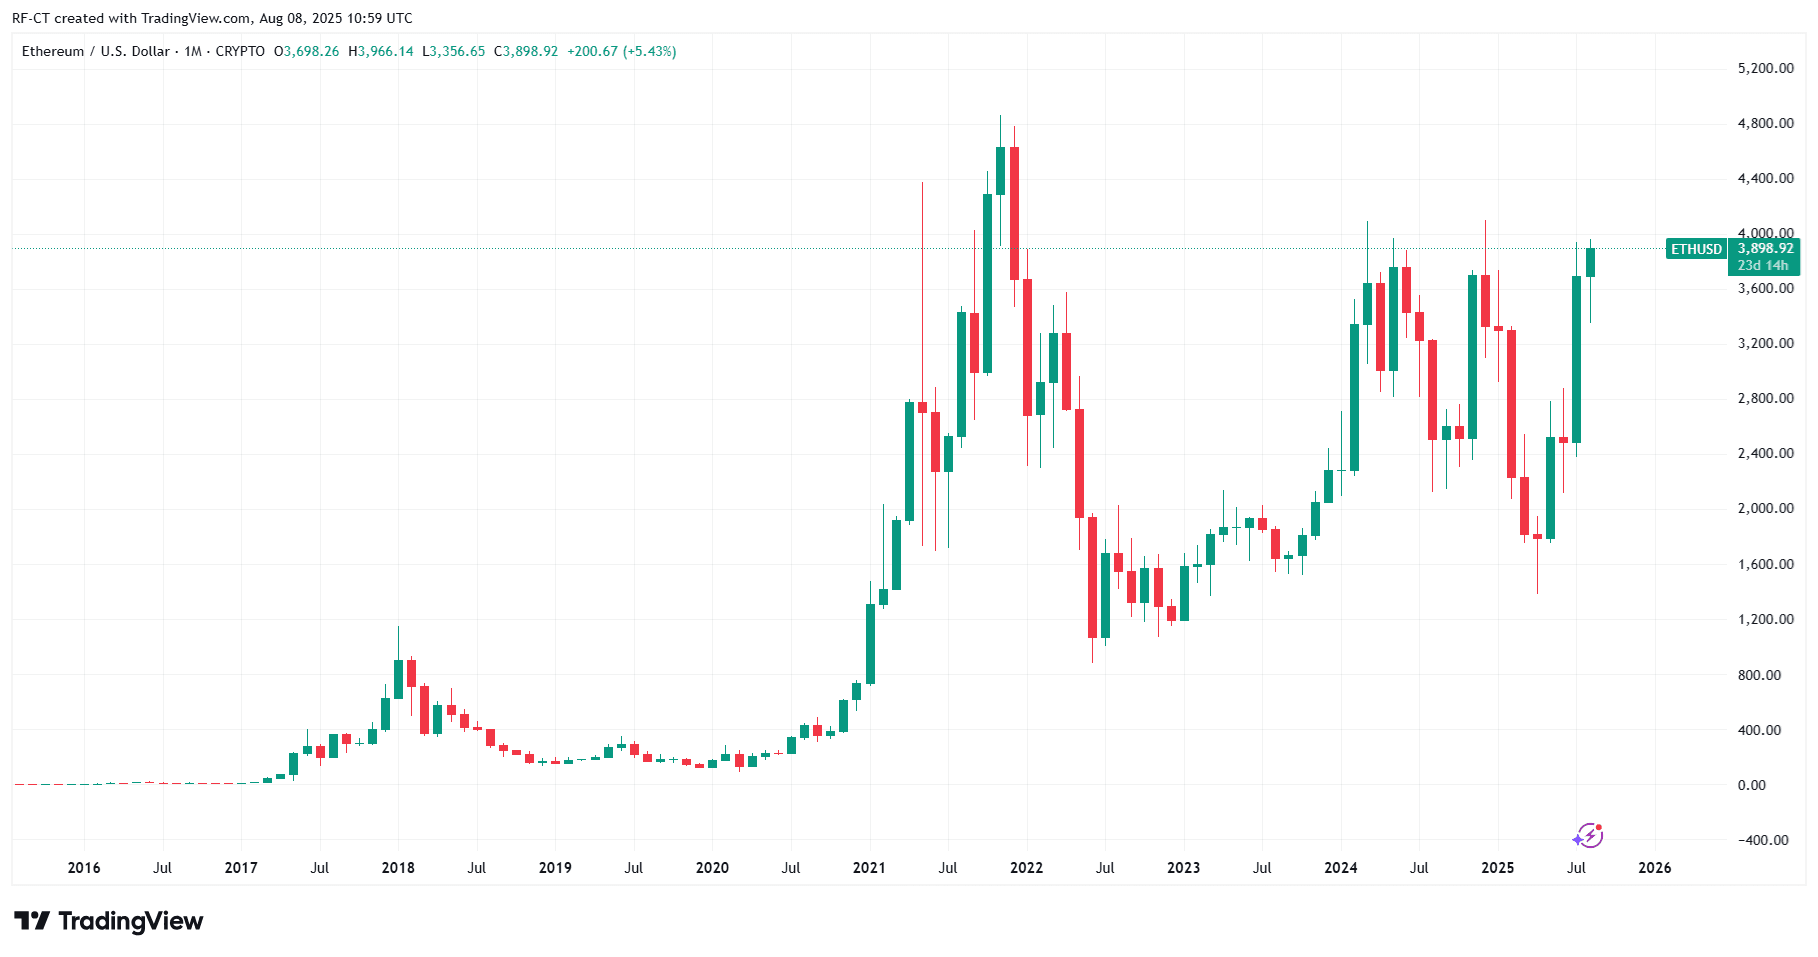 By TradingView - ETHUSD_2025-08-08 (All)
BlackRock’s reported $103M Ethereum purchase adds a new bullish layer to ETH’s market outlook. While the $4,000 resistance remains a formidable barrier, institutional interest combined with healthy technical indicators suggests the bulls have a fighting chance.
💡 Where to Buy ETH: Compare Top Exchanges Here
📊 Live ETH Price: Check Ethereum Price in Real-Time
Disclaimer: The content of this article solely reflects the author's opinion and does not represent the platform in any capacity. This article is not intended to serve as a reference for making investment decisions.
You may also like
VIX surges to highest level since the tariff dispute in April last year; Goldman Sachs Fear Index approaches maximum; US stocks may face another $80 billion sell-off next week
As the U.S. stock market faced a sharp sell-off on Friday, two major Wall Street market risk indicators issued warnings simultaneously.
Nvidia (NVDA.US) plunges 46% over seven weeks, marking the longest losing streak since the 2008 financial crisis, with its market capitalization evaporating by $2.6 trillion.
Nvidia is experiencing its longest consecutive weekly decline since the 2008 global financial crisis.
Overnight U.S. Stocks | Stocks, Gold, and Bitcoin Plunge Indiscriminately as VIX Fear Index Surges to 40, Nasdaq Wipes Out Year-to-Date Gains
At the close, the Dow Jones Industrial Average fell 949.73 points, or 1.93%, to 48,147.32 points; the S&P 500 index dropped 265.44 points, or 3.70%, to 6,910.39 points; and the Nasdaq declined 1,261.46 points, or 5.28%, to 22,617.73 points, down 2.7% year-to-date.
What happened? AI trading crash! Nasdaq drops over 5%, Anthropic IPO nearly breaks on the second day, Nvidia falls over 10%
Investors are not doubting the prospects of AI technology, but are beginning to question whether current valuations have fully priced in future growth. Anthropic's popularity does not prove the investment logic for the entire industry. Since Jensen Huang resigned as CEO, NVIDIA has experienced seven consecutive declines, falling nearly 28% in seven days. After Huang was investigated, news of a SEC accounting investigation added further pressure, causing its market value to evaporate by $2.65 trillion compared to the October peak. AMD closed down more than 10%, plunging for two consecutive days after a short-selling report, and the entire AI industry chain is undergoing widespread sell-off. The return on AI capital expenditure is being questioned, and the unwinding of crowded trades is amplifying the downward trend.
Crypto prices
More


