
Pi Network Token Could Be Preparing for a Breakout After All-Time Low

PI Network's token is showing bullish momentum after a period of consolidation, with key indicators like MACD and BBTrend signaling a potential breakout.
PI Network’s token has remained mostly sideways, showing signs of consolidation since it hit a new all-time low of $0.32 on August 1.
However, bullish momentum is emerging as buyers appear to capitalize on the dip. The question remains whether this growing optimism could translate into more gains in the coming session.
Selling Pressure Eases on PI Token
On the one-day chart, PI’s Moving Average Convergence Divergence (MACD) indicator is approaching a positive crossover, signaling a potential shift in momentum toward buying strength.
For token TA and market updates: Want more token insights like this? Sign up for Editor Harsh Notariya’s Daily Crypto Newsletter
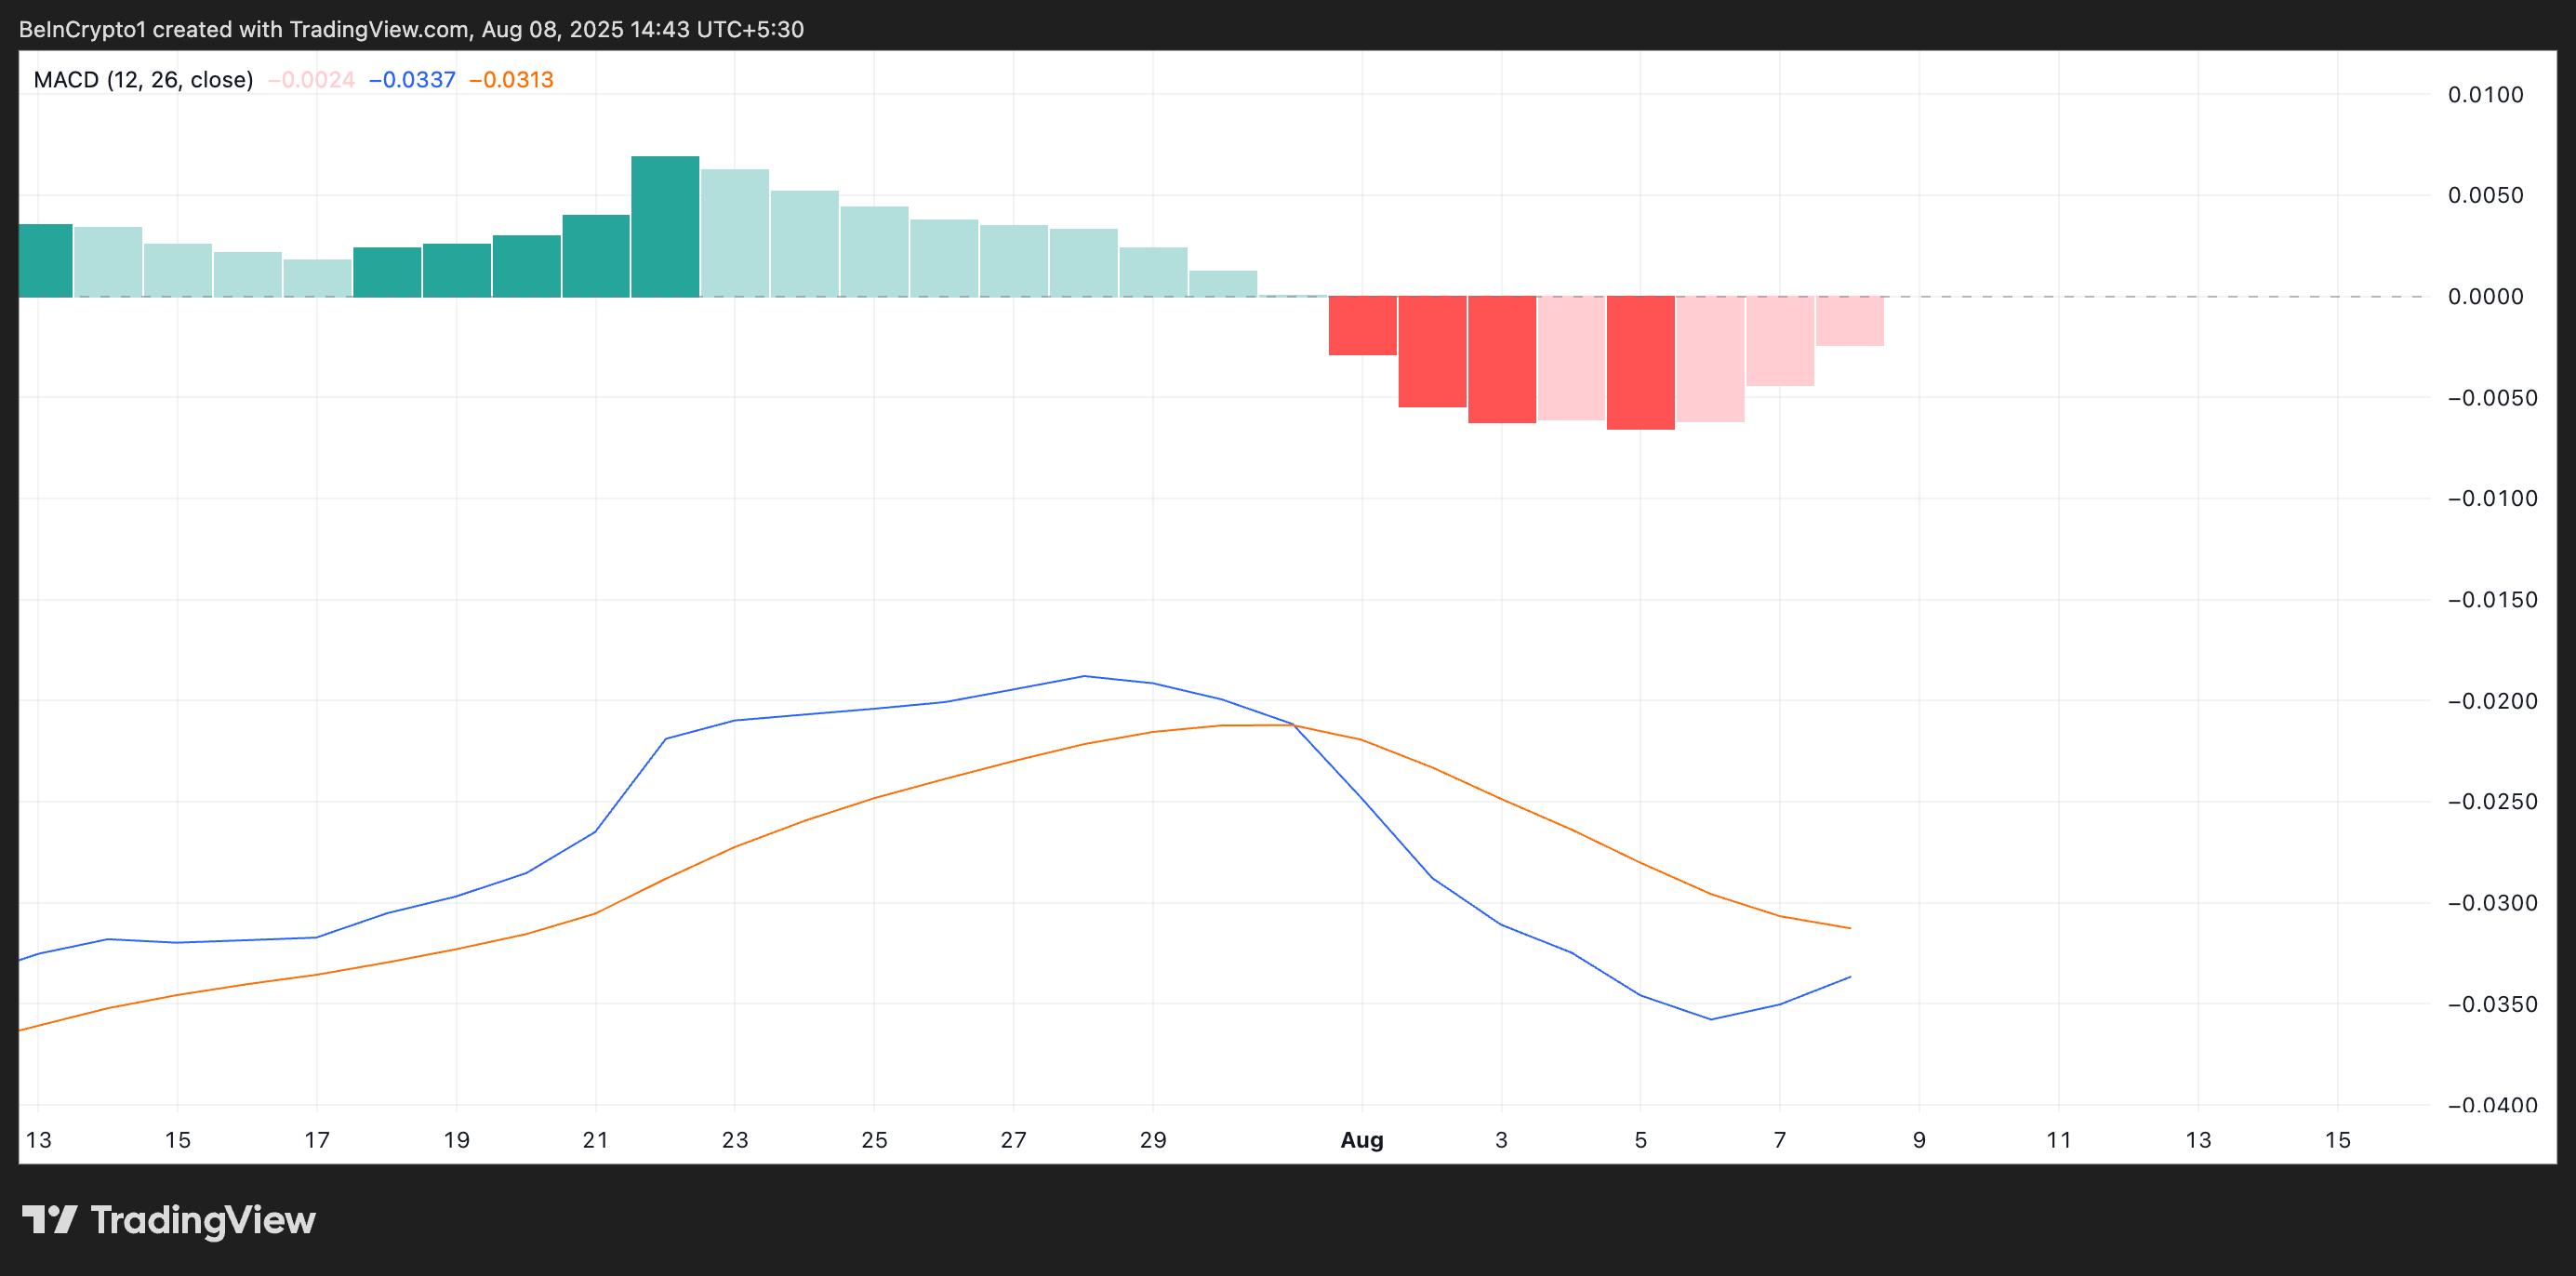 PI MACD. Source:
TradingView
An asset’s MACD indicator identifies trends and momentum in its price movement. It helps traders spot potential buy or sell signals through crossovers between the MACD and signal lines.
A positive crossover occurs when the MACD line (blue) crosses the signal line (orange)
This is a bullish signal because it indicates that the asset’s short-term momentum is gaining strength relative to its longer-term trend. For PI, this means that buying interest is increasing and could push the price higher in the near term.
Additionally, readings from PI’s BBTrend indicator show a steady decline in the sizes of its red bars since the sideways trend began.
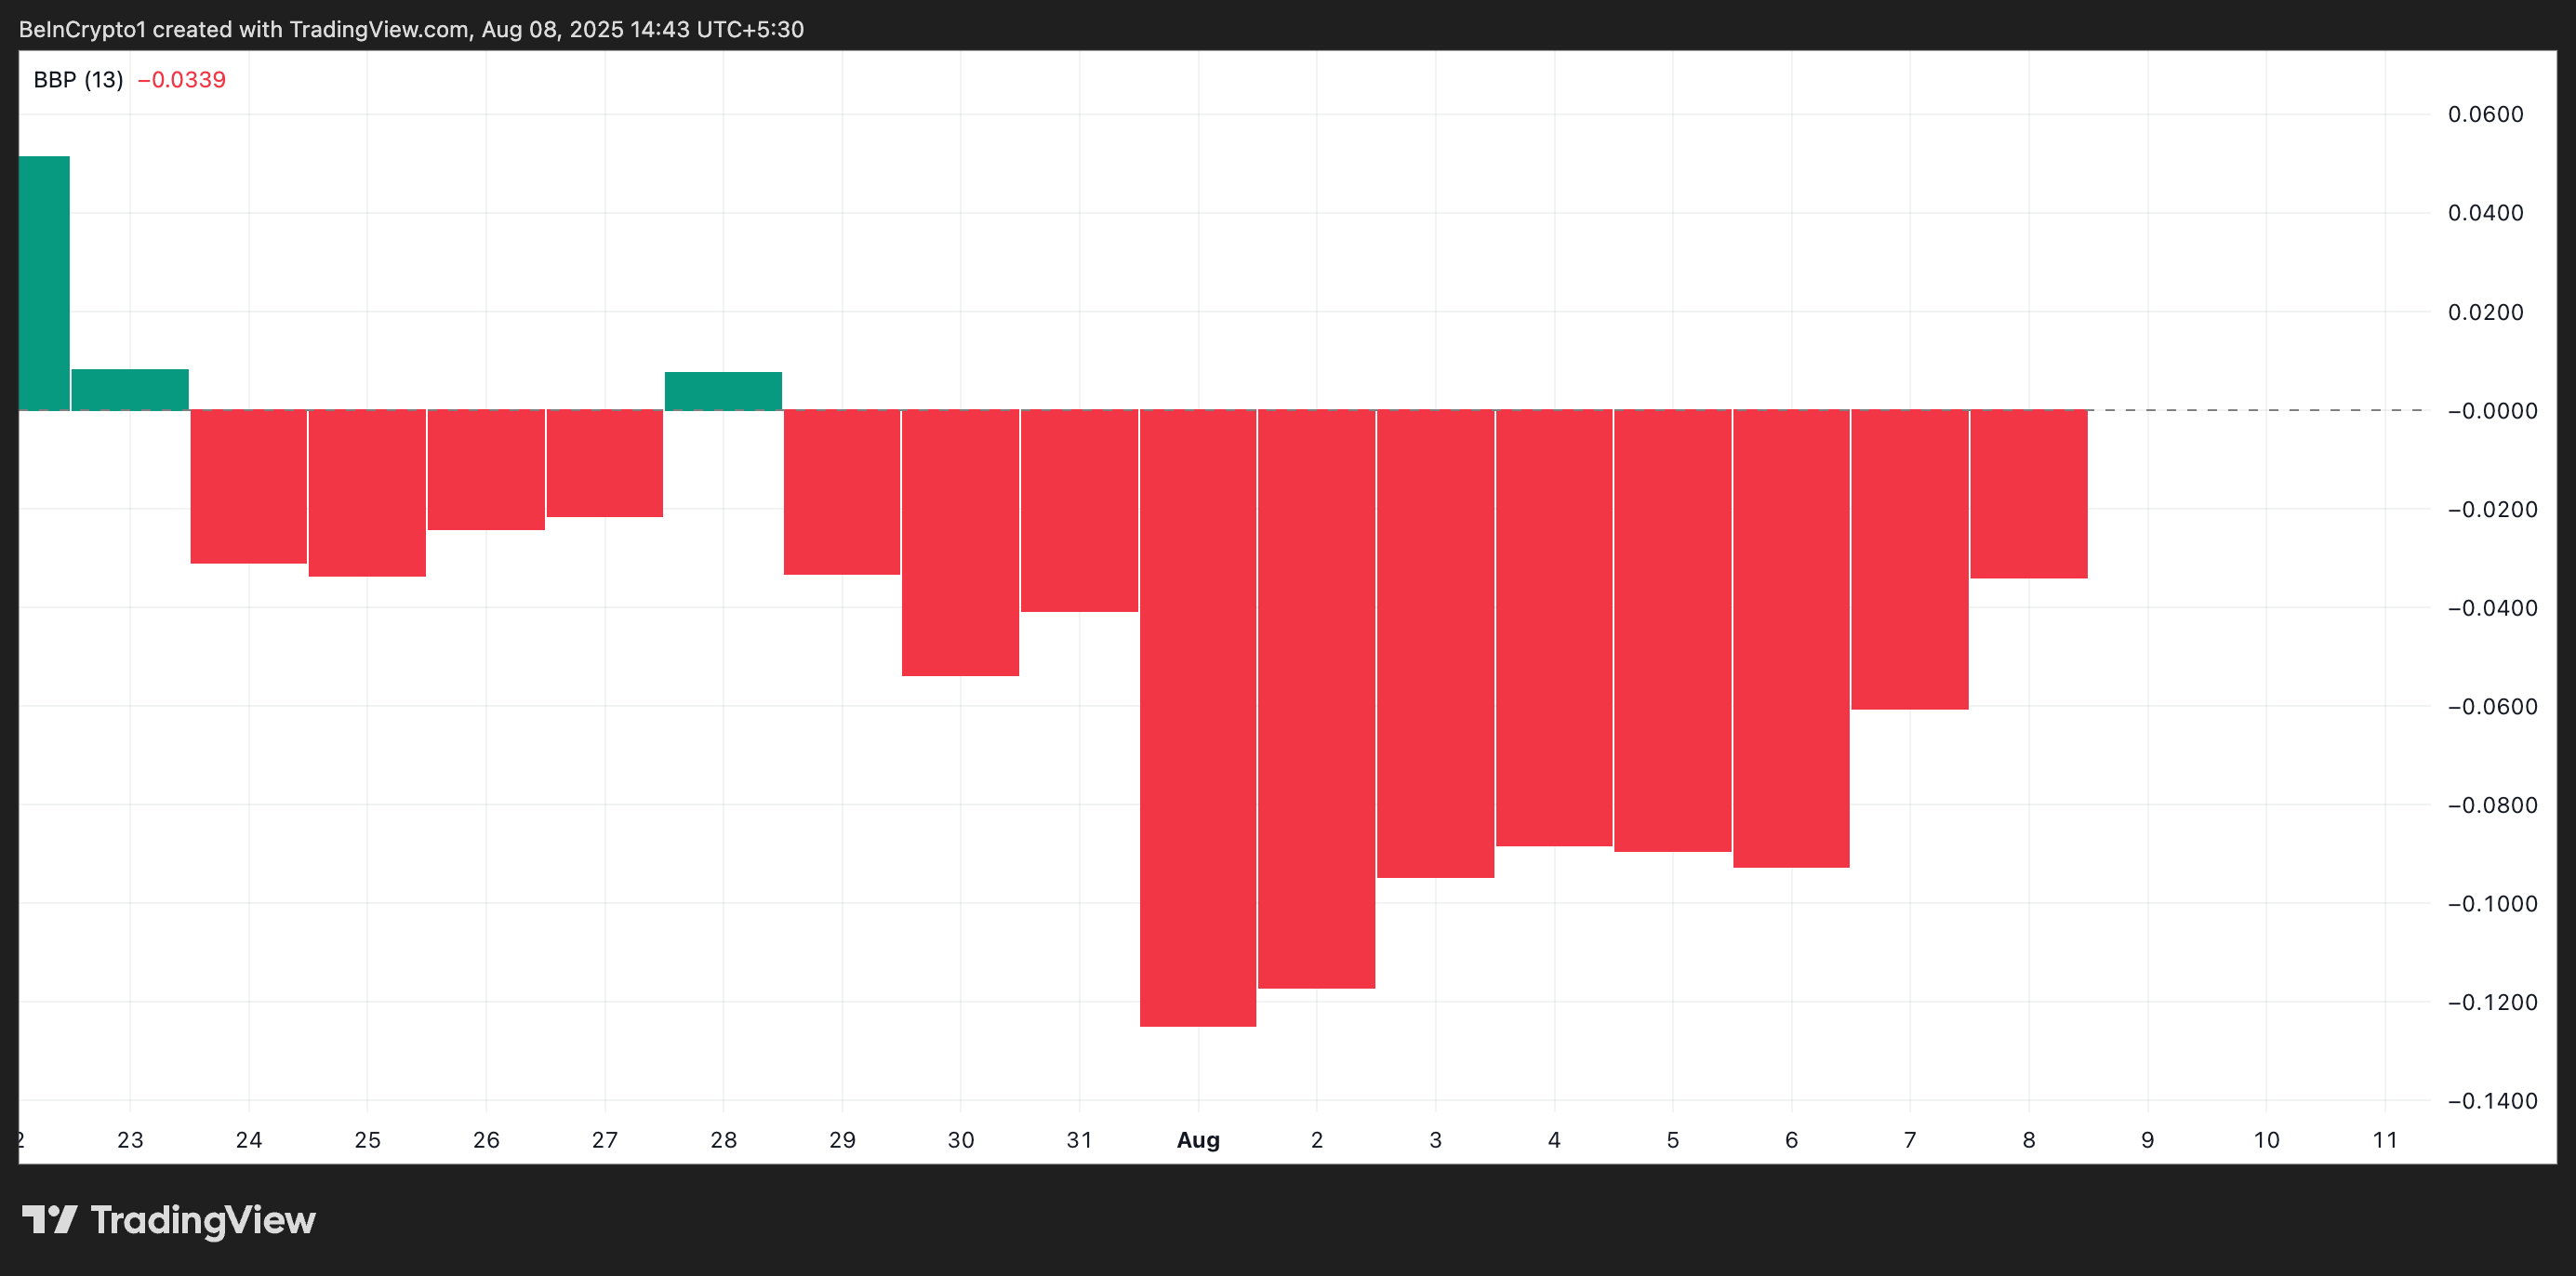 PI BBTrend. Source:
TradingView
The BBTrend measures the strength and direction of a trend based on the expansion and contraction of Bollinger Bands. When it returns red bars, the asset’s price consistently closes near the lower Bollinger Band, reflecting sustained selling pressure.
However, when the sizes of these red bars start to drop, like with PI, selling pressure is easing, and the market sentiment is shifting towards buying.
PI Token’s Next Move Hinges on Demand
A sustained demand for PI could push it above the upper range of its horizontal channel, which forms resistance at $0.37. If successfully turned into a support floor, it could pave the way for a further rally to $0.44.
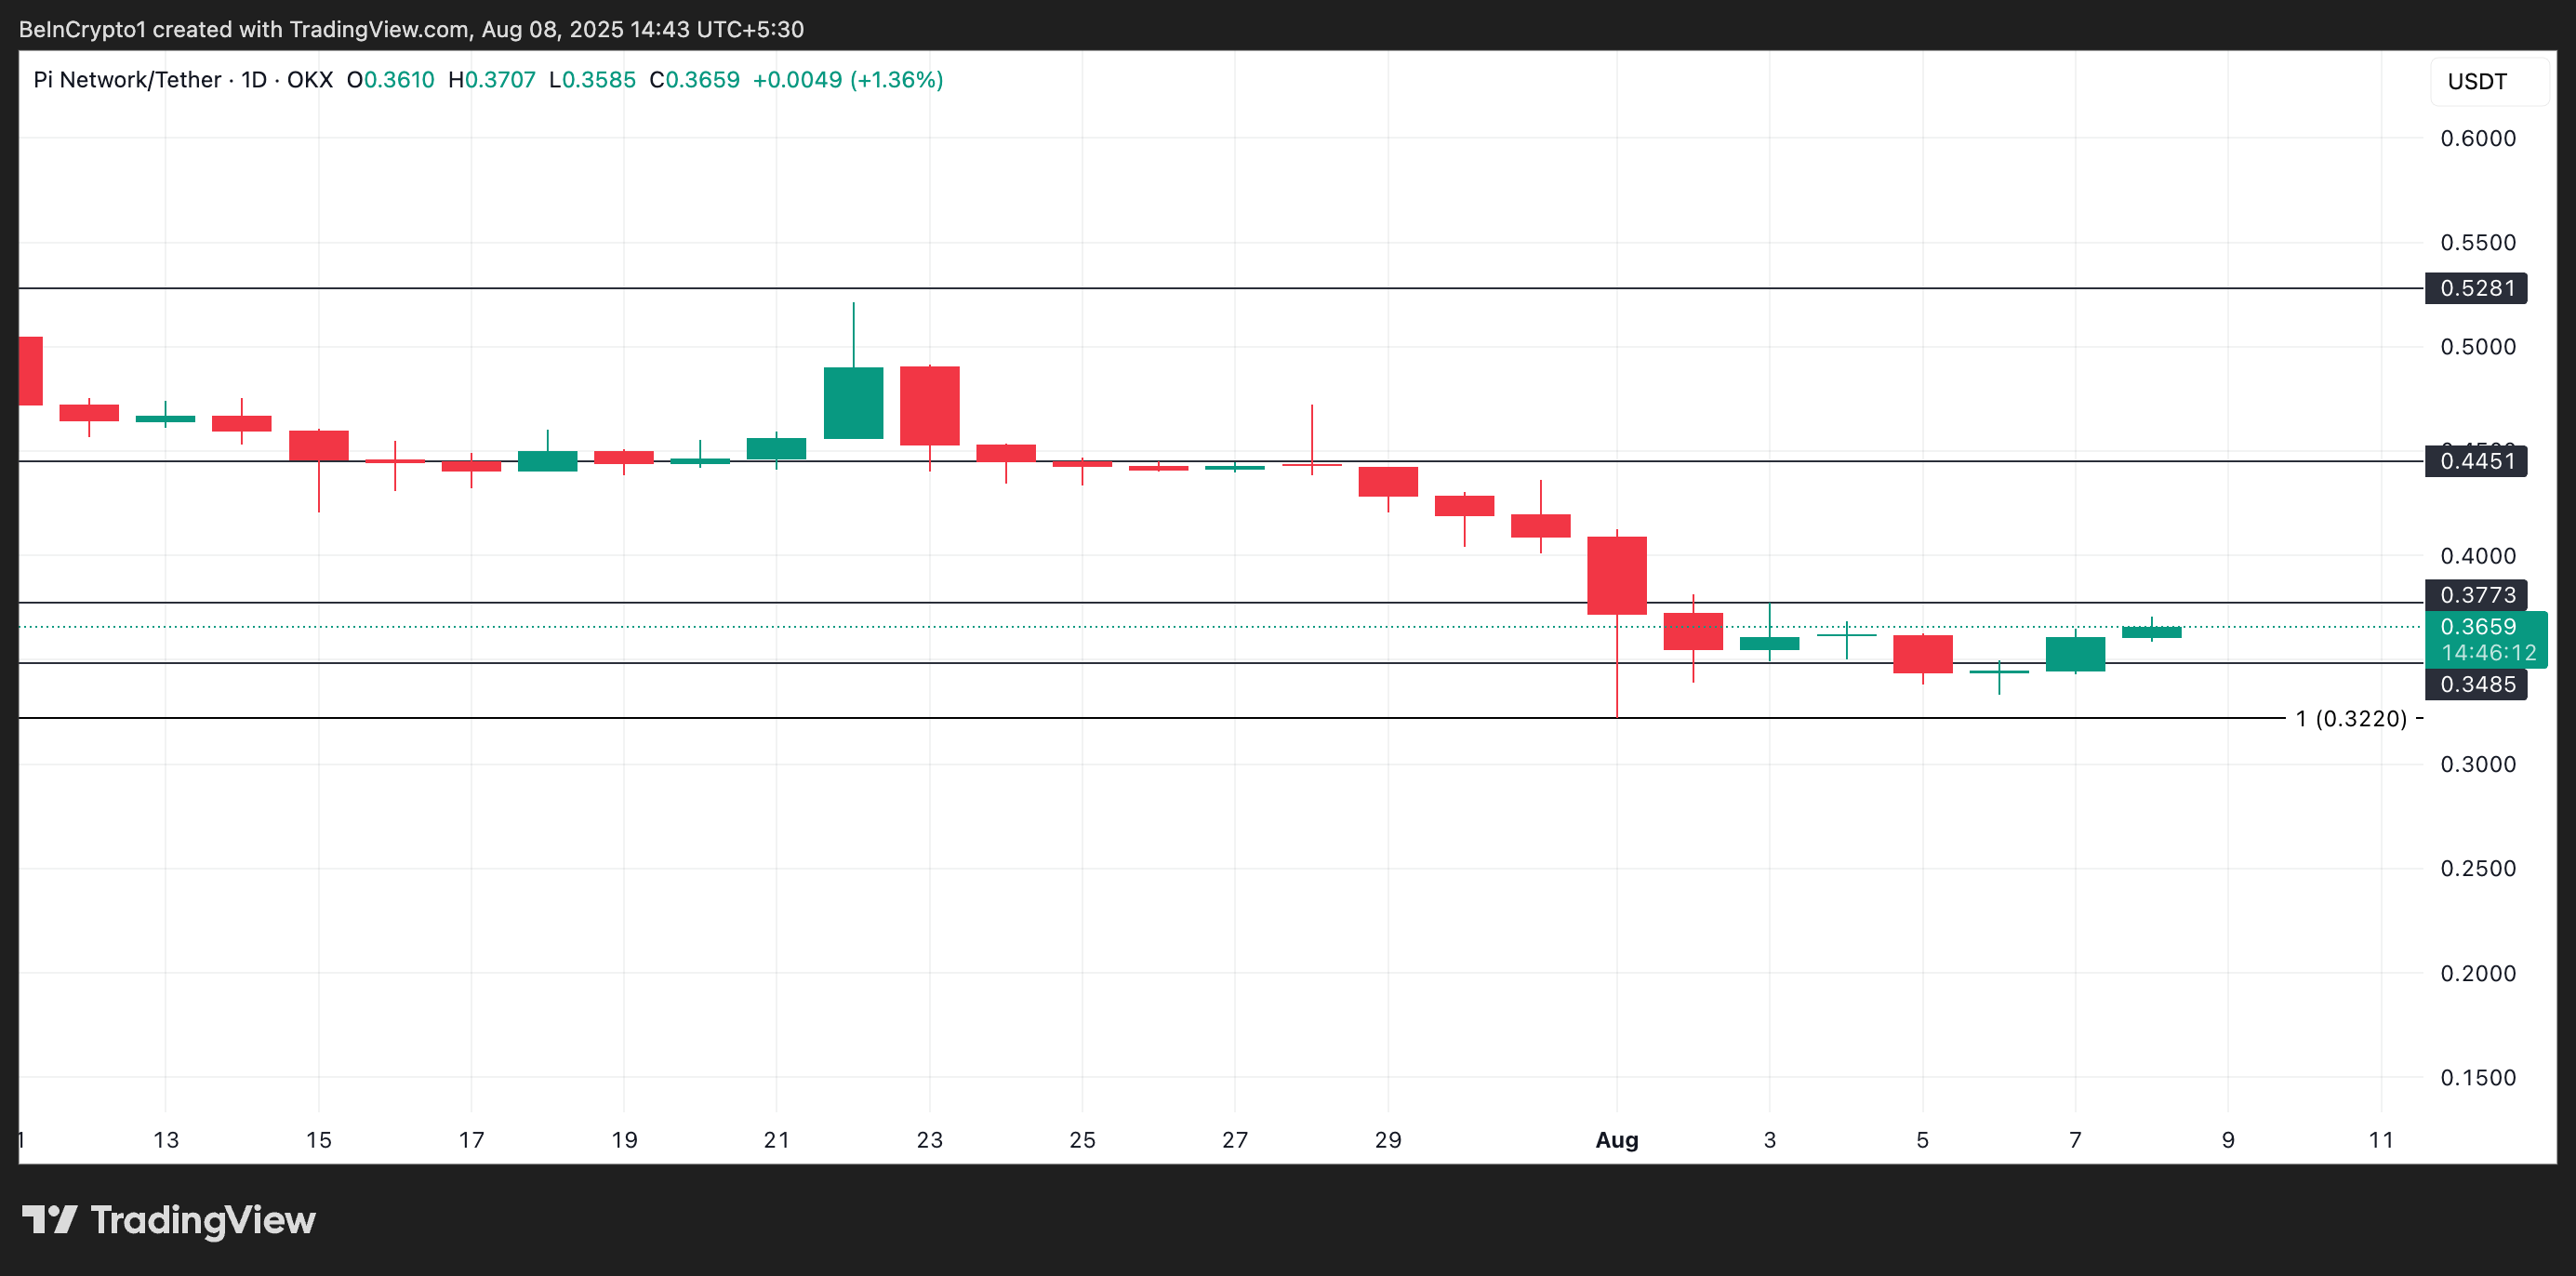 PI Price Analysis. Source:
TradingView
Conversely, if demand weakens again, PI could resume its sideways trend or fall under $0.34.
Disclaimer: The content of this article solely reflects the author's opinion and does not represent the platform in any capacity. This article is not intended to serve as a reference for making investment decisions.
You may also like
Crowded U.S. Treasury Shorts Meet Safe-Haven Buying; Bank of America Warns of Rising "Pain Trade" Risks
After bond traders rebuilt short positions in US Treasuries, they are now facing potential short squeeze risks.
Overnight U.S. Stocks | Dow Jones dropped over 1,000 points intraday, all three major indexes closed lower, SpaceX (SPCX.US) rose over 3% against the trend
By the close, the Dow Jones Industrial Average had dropped 848.75 points, or 1.64%, to finish at 50,759.42 points. The index fell more than 1,000 points during intraday trading. The S&P 500 declined 1.03% to close at 7,340.53 points, marking its lowest closing level since the end of July.
High interest rates and AI disruption raise concerns as the US banking sector nears a rare "death cross"; Goldman Sachs (GS.US) and Morgan Stanley (MS.US) shares have fallen about 20% from their August highs
Major U.S. bank stocks are approaching the "death cross" pattern, which is considered a bearish signal in technical analysis.
Nvidia (NVDA.US) Q3 revenue doubled year-over-year to $115.8 billion; data center business revenue grew 110% year-over-year; after-hours stock price surged over 2%
Driven by continued strong demand for artificial intelligence infrastructure, Nvidia achieved substantial growth in both Q3 revenue and profit, with data center business revenue more than doubling year-over-year.
Crypto prices
More


