

Chainlink (LINK) is experiencing a notable price surge of 13% as whale wallets accumulate over 0.5% of the token’s supply, indicating strong bullish momentum.
-
LINK is currently trading at $18.89, with a 300% increase in trading volume over the last 24 hours.
-
Whales added 0.67% of the total supply in August, driven by significant network upgrades.
-
Technical indicators suggest a bullish outlook, with potential resistance levels above $20.
Chainlink (LINK) has surged 13% recently, driven by whale accumulation and strong trading activity. Discover the latest developments and technical analysis.
What is Driving Chainlink’s Recent Price Surge?
Chainlink (LINK) is currently trading at $18.89, reflecting a 13% increase in the past 24 hours. This surge is attributed to significant whale accumulation, with major investors adding over 0.5% of the total supply in just over a week. The momentum is further supported by a 300% increase in trading volume, reaching $1.37 billion.
How Are Whales Influencing Chainlink’s Market Activity?
According to on-chain data from Santiment, wallets holding between 100,000 and 1 million LINK increased by 4.2% in August, accumulating an additional 0.67% of the total supply. This activity coincides with several major developments in the Chainlink network, enhancing its utility and attracting investor interest.
Chainlink’s Recent Developments and Technical Analysis
Chainlink has introduced several key upgrades, including the launch of Data Streams for U.S. stocks, which allows access to real-time data for tokenized assets. Additionally, the Chainlink Reserve was unveiled to support long-term growth and incentivize node operators. These developments have contributed to increased whale activity.
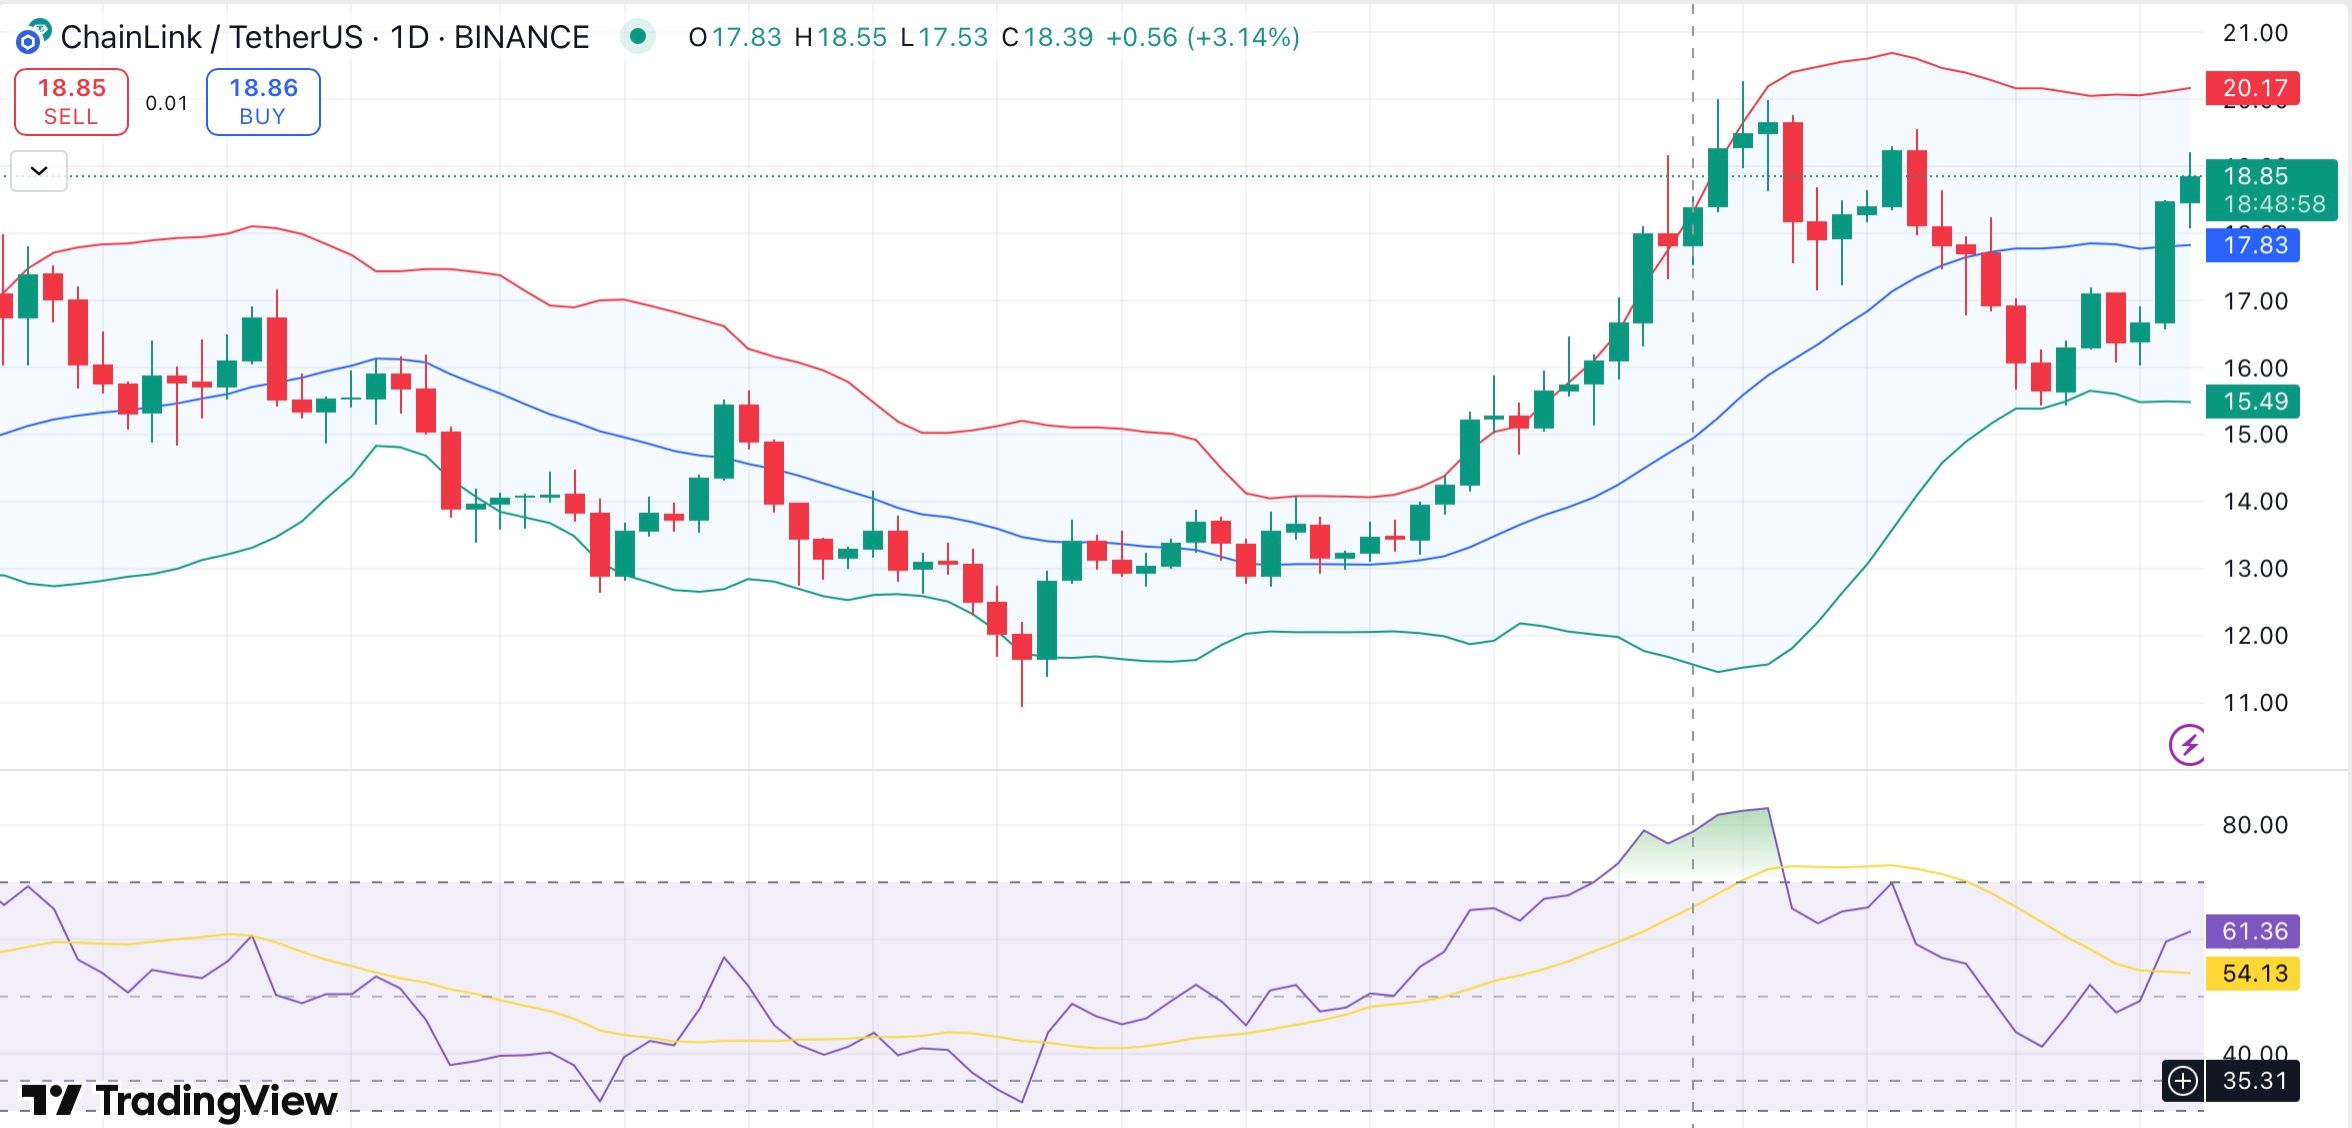 Chainlink daily chart. Credit: crypto.news
Technical indicators show a positive outlook for LINK. All major moving averages are in buy territory, indicating strong trend support. The relative strength index is at 61, suggesting further growth potential before reaching overbought conditions. The next resistance level is likely around $20.50–$21, contingent on sustained whale accumulation.
Frequently Asked Questions
What is Chainlink?
Chainlink is a decentralized oracle network that enables smart contracts on various blockchains to securely interact with real-world data and external APIs.
Why are whales accumulating Chainlink?
Whales are accumulating Chainlink due to its recent network upgrades and increased utility, which are expected to drive future price appreciation.
Key Takeaways
- Whale Activity: Major investors are accumulating LINK, indicating bullish sentiment.
- Price Surge: LINK has risen 13% in 24 hours, supported by increased trading volume.
- Technical Indicators: Positive trends suggest potential resistance levels above $20.
Conclusion
Chainlink’s recent price surge and whale accumulation highlight a strong bullish sentiment in the market. With ongoing network developments and positive technical indicators, LINK is poised for potential growth. Investors should monitor these trends closely as they could signal a breakout above key resistance levels.


