Bitget App
Trade smarter
Buy cryptoMarketsTradeFuturesStocksEarnInstitutionAI & More
LTC Price Explodes 11% with Litecoin Claiming 2nd Spot in Crypto Payments

LTC Price Explodes 11% with Litecoin Claiming 2nd Spot in Crypto Payments

CoinspeakerCoinspeaker2025/08/04 16:00
By:By Parth Dubey Editor Julia Sakovich

Up over 40% in a month and 11% in a day, LTC now ranks as the second most-used crypto for payments, behind only Bitcoin.

Key Notes

  • Litecoin (LTC) jumped 11% in 24 hours, reaching $124.90 and gaining over 40% in the past month.
  • LTC has overtaken USDC and TRON to become the second most-used crypto for payments on CoinGate.
  • With 340 million transactions processed and 12% occurring in 2025 alone, LTC adoption is booming.

Litecoin LTC $121.7 24h volatility: 9.0% Market cap: $9.27 B Vol. 24h: $1.71 B has gained over 11% in the past 24 hours, reaching an intraday high of $124.90 before settling near $122 at press time. This explosion follows a strong July performance, with LTC posting a 40.85% gain in the past month. 

According to CoinGate, a major crypto payments processor, Litecoin has climbed to the second most-used cryptocurrency for payments, behind only Bitcoin .  CoinMarketCap data shows BTC BTC $114 246 24h volatility: 0.3% Market cap: $2.27 T Vol. 24h: $31.99 B is up 118% while LTC printed 130% in gains in the past year.

Our July data reveals changes in crypto payment preferences:

🥇Bitcoin leads at 22.9%
📈Litecoin climbs as 2nd to 14.5%
🥉USDC rises at 14% 
💥 TRON enters top 4 at 12.9%

Which cryptos will be at the top in August? 🤔 pic.twitter.com/yzGdO8AwV3

— CoinGate (@CoinGatecom) August 4, 2025

Litecoin Payments on the Rise

In July, LTC accounted for 14.5% of all crypto payments on the platform, overtaking USDC USDC $1.00 24h volatility: 0.0% Market cap: $64.36 B Vol. 24h: $12.38 B (14%) and TRON  TRX $0.33 24h volatility: 0.9% Market cap: $31.51 B Vol. 24h: $798.81 M (12.9%). Bitcoin still leads with a 22.9% share, but Litecoin’s rising adoption is turning heads across the industry.

The network also crossed a major milestone in August with 340 million transactions processed since inception, more than 12% of those occurring in 2025 alone. That’s nearly 40 million transactions in just seven months.

The Litecoin Network just processed its 340 Millionth transaction. Having hit 300 million back on Jan 8th 2025, this means ~12% of all $LTC transactions since 2011 have occur in 2025. Proof again Litecoin is accelerating! ⚡️ pic.twitter.com/R7sPIiQ4IN

— Litecoin Foundation ⚡️ (@LTCFoundation) August 3, 2025

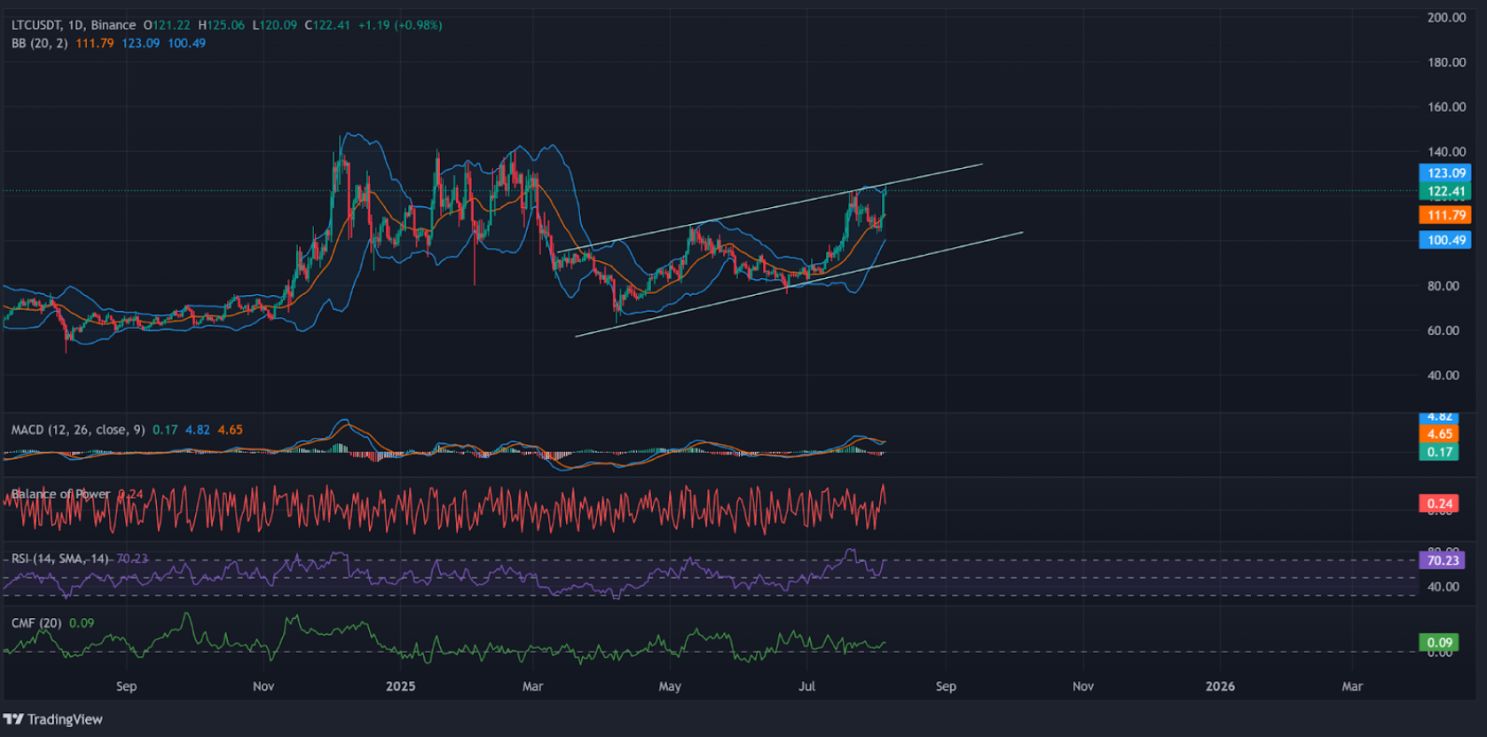
LTC Price Analysis: Price Eyes $140 as Bullish Channel Holds

LTC is trading within a well-defined ascending parallel channel, with price currently testing the upper boundary near $124. The altcoin trades well above the 20-day and 50-day EMAs, at $102 and $109, respectively.

Bollinger Bands show LTC is riding the upper band, indicative of upward volatility with little resistance in sight, while the MACD remains in bullish territory with widening histograms. It’s clear with CMF at 0.09 that LTC accumulation is on the rise.
LTC Price Explodes 11% with Litecoin Claiming 2nd Spot in Crypto Payments image 0

LTC Daily Chart with Momentum Indicators | Source: TradingView

If momentum sustains, a clean breakout above the $125 resistance could send Litecoin toward the next major target at $140, in line with the upper channel extension. 

On the downside, strong support lies at $111 and $102, key EMAs that previously acted as resistance. With Polymarket data showing an 81% probability of an LTC ETF approval in 2025, the altcoin is positioned as one of the best crypto to buy in 2025.

0
0

Disclaimer: The content of this article solely reflects the author's opinion and does not represent the platform in any capacity. This article is not intended to serve as a reference for making investment decisions.

Understand the market, then trade.
Bitget offers one-stop trading for cryptocurrencies, stocks, and gold.
Trade now!

You may also like

After a week of "bloodbath" in US stocks, valuations now show investment value, but no one dares to say the bottom has arrived.

Last week, U.S. stocks experienced a massive sell-off, but in fact, there have been no fundamental changes in the underlying factors. Multiple valuation indicators now highlight their investment value, and the willingness of contrarian funds to buy the dip should be strong.

智通财经•2026/11/22 23:16
After a week of "bloodbath" in US stocks, valuations now show investment value, but no one dares to say the bottom has arrived.

The script at the end of 2018: The Federal Reserve continued to raise interest rates, US stocks plunged 20% from the September highs, forcing the Federal Reserve to "pivot" in January.

Goldman Sachs' head of trading believes the current US stock market is repeating the scenario of late 2018, with monetary tightening and equity market pressure. The Goldman Sachs Financial Conditions Index has tightened by about 8 points in two weeks, reaching the highest level in a year. The selloff has broadened from tech stocks to defensive sectors. Gold and equities are declining simultaneously, possibly indicating investors are selling assets to raise cash, making gold a key indicator for observing liquidity stress.

华尔街见闻•2026/11/21 05:31
The script at the end of 2018: The Federal Reserve continued to raise interest rates, US stocks plunged 20% from the September highs, forcing the Federal Reserve to "pivot" in January.

Goldman Sachs Trader “Revisits the 2018 Playbook”: Still Clearly Remembers “On December 24th, Clients Asked Why the Market Dropped So Much—And I Had No Idea”

Brian Garrett pointed out that the current adjustment in the US stock market is similar to the sharp decline in Q4 2018: the S&P 500 has already experienced 42% of the corresponding drop, and the VIX is approaching its peak just before Christmas. If history repeats itself, the bottom of this cycle may appear in January next year. However, the credit market and Federal Reserve policy have yet to provide clear signals of a bottom.

华尔街见闻•2026/11/21 03:51

Anthropic (ANT.US) nearly “broke issue price,” but Claude knocks on the doors of “the highest peak in mathematics”! 17 million lines of Lean code used to write a candidate proof for the Riemann Hypothesis

On November 20th, Eastern Time, on its second day of trading, Anthropic's intraday price dropped to a low of $83.05, just 5 cents above the offering price of $83, and finally closed at $88.91, a decline of 8.50%. On the same day, the company's mathematician Levant Alperg announced on his personal website that he and Claude had found a candidate proof for the Riemann hypothesis, which has puzzled the mathematics community for 167 years, and released about 17 million lines of Lean formalized code.

智通财经•2026/11/21 03:21
Anthropic (ANT.US) nearly “broke issue price,” but Claude knocks on the doors of “the highest peak in mathematics”! 17 million lines of Lean code used to write a candidate proof for the Riemann Hypothesis
