Bitget App
Trade smarter
Buy cryptoMarketsTradeFuturesStocksEarnInstitutionAI & More
Hyperliquid (HYPE) To Bounceback? Key Harmonic Pattern Signals Potential Upside Move

Hyperliquid (HYPE) To Bounceback? Key Harmonic Pattern Signals Potential Upside Move

CoinsProbeCoinsProbe2025/08/03 10:30
By:Nilesh Hembade

Date: Sun, Aug 03, 2025 | 09:38 AM GMT

The broader crypto market continues to struggle under selling pressure, with Ethereum (ETH) leading the drop — falling from its recent high of $3,940 to around $3,460. That’s an 8% weekly decline, and the impact has been felt across the major altcoins . Hyperliquid (HYPE) hasn’t escaped the storm either, shedding 10% over the past week and giving up its monthly gains.

But even amid the decline, there may be a silver lining. A developing harmonic pattern on HYPE’s daily chart suggests that a potential bounce back could be in motion.

Hyperliquid (HYPE) To Bounceback? Key Harmonic Pattern Signals Potential Upside Move image 0 Source: Coinmarketcap

Harmonic Pattern Hints at Potential Bounce

On the daily timeframe, HYPE is shaping a Bearish ABCD harmonic pattern — a structure that, despite its name, often features a strong bullish move in the CD leg before reaching a potential reversal zone.

The pattern initiated at Point A (~$30.93), rallied to Point B, retraced to Point C (~$35.47) — where it bounced from the 100-day moving average area — and has since climbed to the current level around $38.50. This bounce marks the early phase of the CD leg, which could propel HYPE higher toward Point D, completing the harmonic formation.
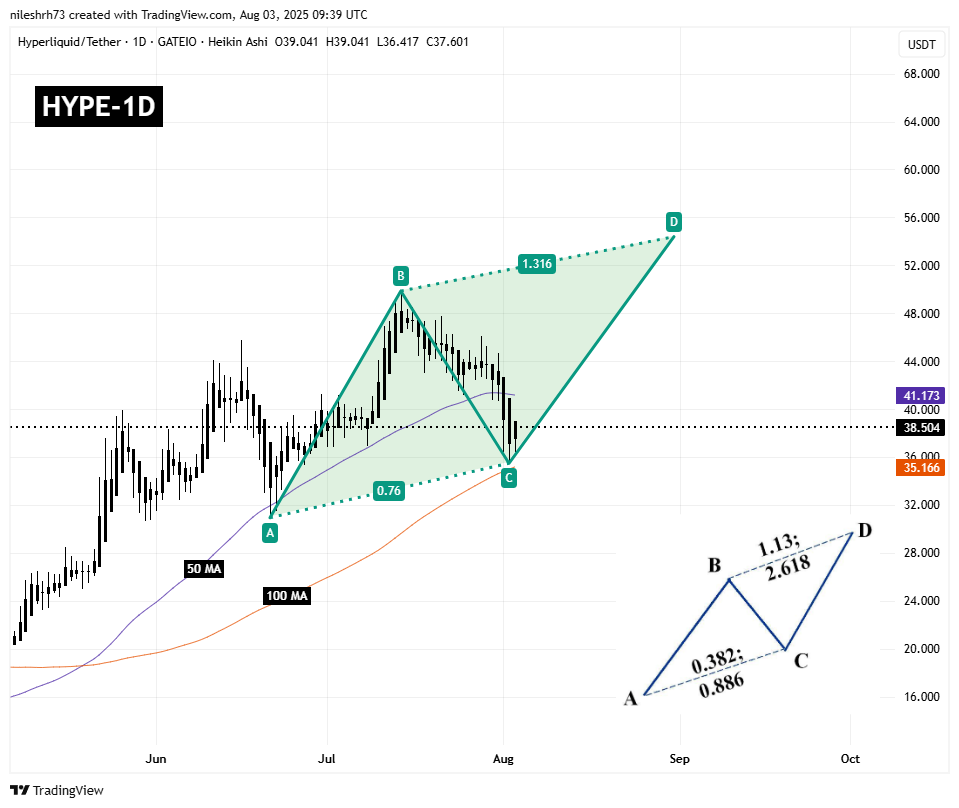
Hyperliquid (HYPE) To Bounceback? Key Harmonic Pattern Signals Potential Upside Move image 1 Hyperliquid (HYPE) Daily Chart/Coinsprobe (Source: Tradingview)

A move above the 50-day moving average ($41.17) would strengthen the bullish outlook and confirm pattern progression.

What’s Next for HYPE?

If HYPE maintains its upward momentum and decisively clears the 50-day MA, the next major target lies near the Potential Reversal Zone (PRZ). This is defined by the 1.31 Fibonacci extension of the BC leg — landing near $54.39, which suggests a 41% potential upside from current prices.

However, the pattern is not bulletproof. If bulls fail to hold support at the 100-day MA ($35.16) or the C-leg low around $35.47, the harmonic setup would be invalidated — potentially opening the door for a drop back toward the $31.00 region.


0
0

Disclaimer: The content of this article solely reflects the author's opinion and does not represent the platform in any capacity. This article is not intended to serve as a reference for making investment decisions.

Understand the market, then trade.
Bitget offers one-stop trading for cryptocurrencies, stocks, and gold.
Trade now!

You may also like

The script at the end of 2018: The Federal Reserve continued to raise interest rates, US stocks plunged 20% from the September highs, forcing the Federal Reserve to "pivot" in January.

Goldman Sachs' head of trading believes the current US stock market is repeating the scenario of late 2018, with monetary tightening and equity market pressure. The Goldman Sachs Financial Conditions Index has tightened by about 8 points in two weeks, reaching the highest level in a year. The selloff has broadened from tech stocks to defensive sectors. Gold and equities are declining simultaneously, possibly indicating investors are selling assets to raise cash, making gold a key indicator for observing liquidity stress.

华尔街见闻•2026/11/21 05:31
The script at the end of 2018: The Federal Reserve continued to raise interest rates, US stocks plunged 20% from the September highs, forcing the Federal Reserve to "pivot" in January.

Goldman Sachs Trader “Revisits the 2018 Playbook”: Still Clearly Remembers “On December 24th, Clients Asked Why the Market Dropped So Much—And I Had No Idea”

Brian Garrett pointed out that the current adjustment in the US stock market is similar to the sharp decline in Q4 2018: the S&P 500 has already experienced 42% of the corresponding drop, and the VIX is approaching its peak just before Christmas. If history repeats itself, the bottom of this cycle may appear in January next year. However, the credit market and Federal Reserve policy have yet to provide clear signals of a bottom.

华尔街见闻•2026/11/21 03:51

Anthropic (ANT.US) nearly “broke issue price,” but Claude knocks on the doors of “the highest peak in mathematics”! 17 million lines of Lean code used to write a candidate proof for the Riemann Hypothesis

On November 20th, Eastern Time, on its second day of trading, Anthropic's intraday price dropped to a low of $83.05, just 5 cents above the offering price of $83, and finally closed at $88.91, a decline of 8.50%. On the same day, the company's mathematician Levant Alperg announced on his personal website that he and Claude had found a candidate proof for the Riemann hypothesis, which has puzzled the mathematics community for 167 years, and released about 17 million lines of Lean formalized code.

智通财经•2026/11/21 03:21
Anthropic (ANT.US) nearly “broke issue price,” but Claude knocks on the doors of “the highest peak in mathematics”! 17 million lines of Lean code used to write a candidate proof for the Riemann Hypothesis

As US stocks plummet, the parent company of GTA 6 rises against the market! First-day sales hit a record $3.79 billion; Wall Street shifts focus to next-generation GTA Online.

According to Rentrak data, the global box office of "Grand Theft Auto VI" has also surpassed that of "Avengers: Endgame," the highest-grossing film of all time, which has a global box office of approximately $2.94 billion.

智通财经•2026/11/21 02:41
As US stocks plummet, the parent company of GTA 6 rises against the market! First-day sales hit a record $3.79 billion; Wall Street shifts focus to next-generation GTA Online.
