
Bitcoin’s $150,000 Dream Hinges on One Bullish Pattern: Breakout or Breakdown?

Bitcoin price is consolidating just above $115,000 after a slight correction, but one bullish pennant on the 3-day chart could determine its next big move. On-chain signals show reduced exchange activity and growing accumulation, setting up a potential 25% rally toward $150,000 if resistance breaks.
Bitcoin price has corrected by around 2.4% in the last 24 hours, holding just above $115,000. While traders remain cautious, one bullish pattern could decide whether Bitcoin makes a big push toward $150,000 or risks losing its upward momentum.
Let’s break down the key signals shaping this pivotal moment.
Fund Flow Ratio Points to Lower Selling Pressure
The Fund Flow Ratio measures how many coins are being moved to and from exchanges compared to total on-chain transfers. A higher ratio usually means increased exchange activity, often linked to selling. A drop in the ratio means fewer coins are heading toward exchanges, signaling reduced immediate sell pressure.
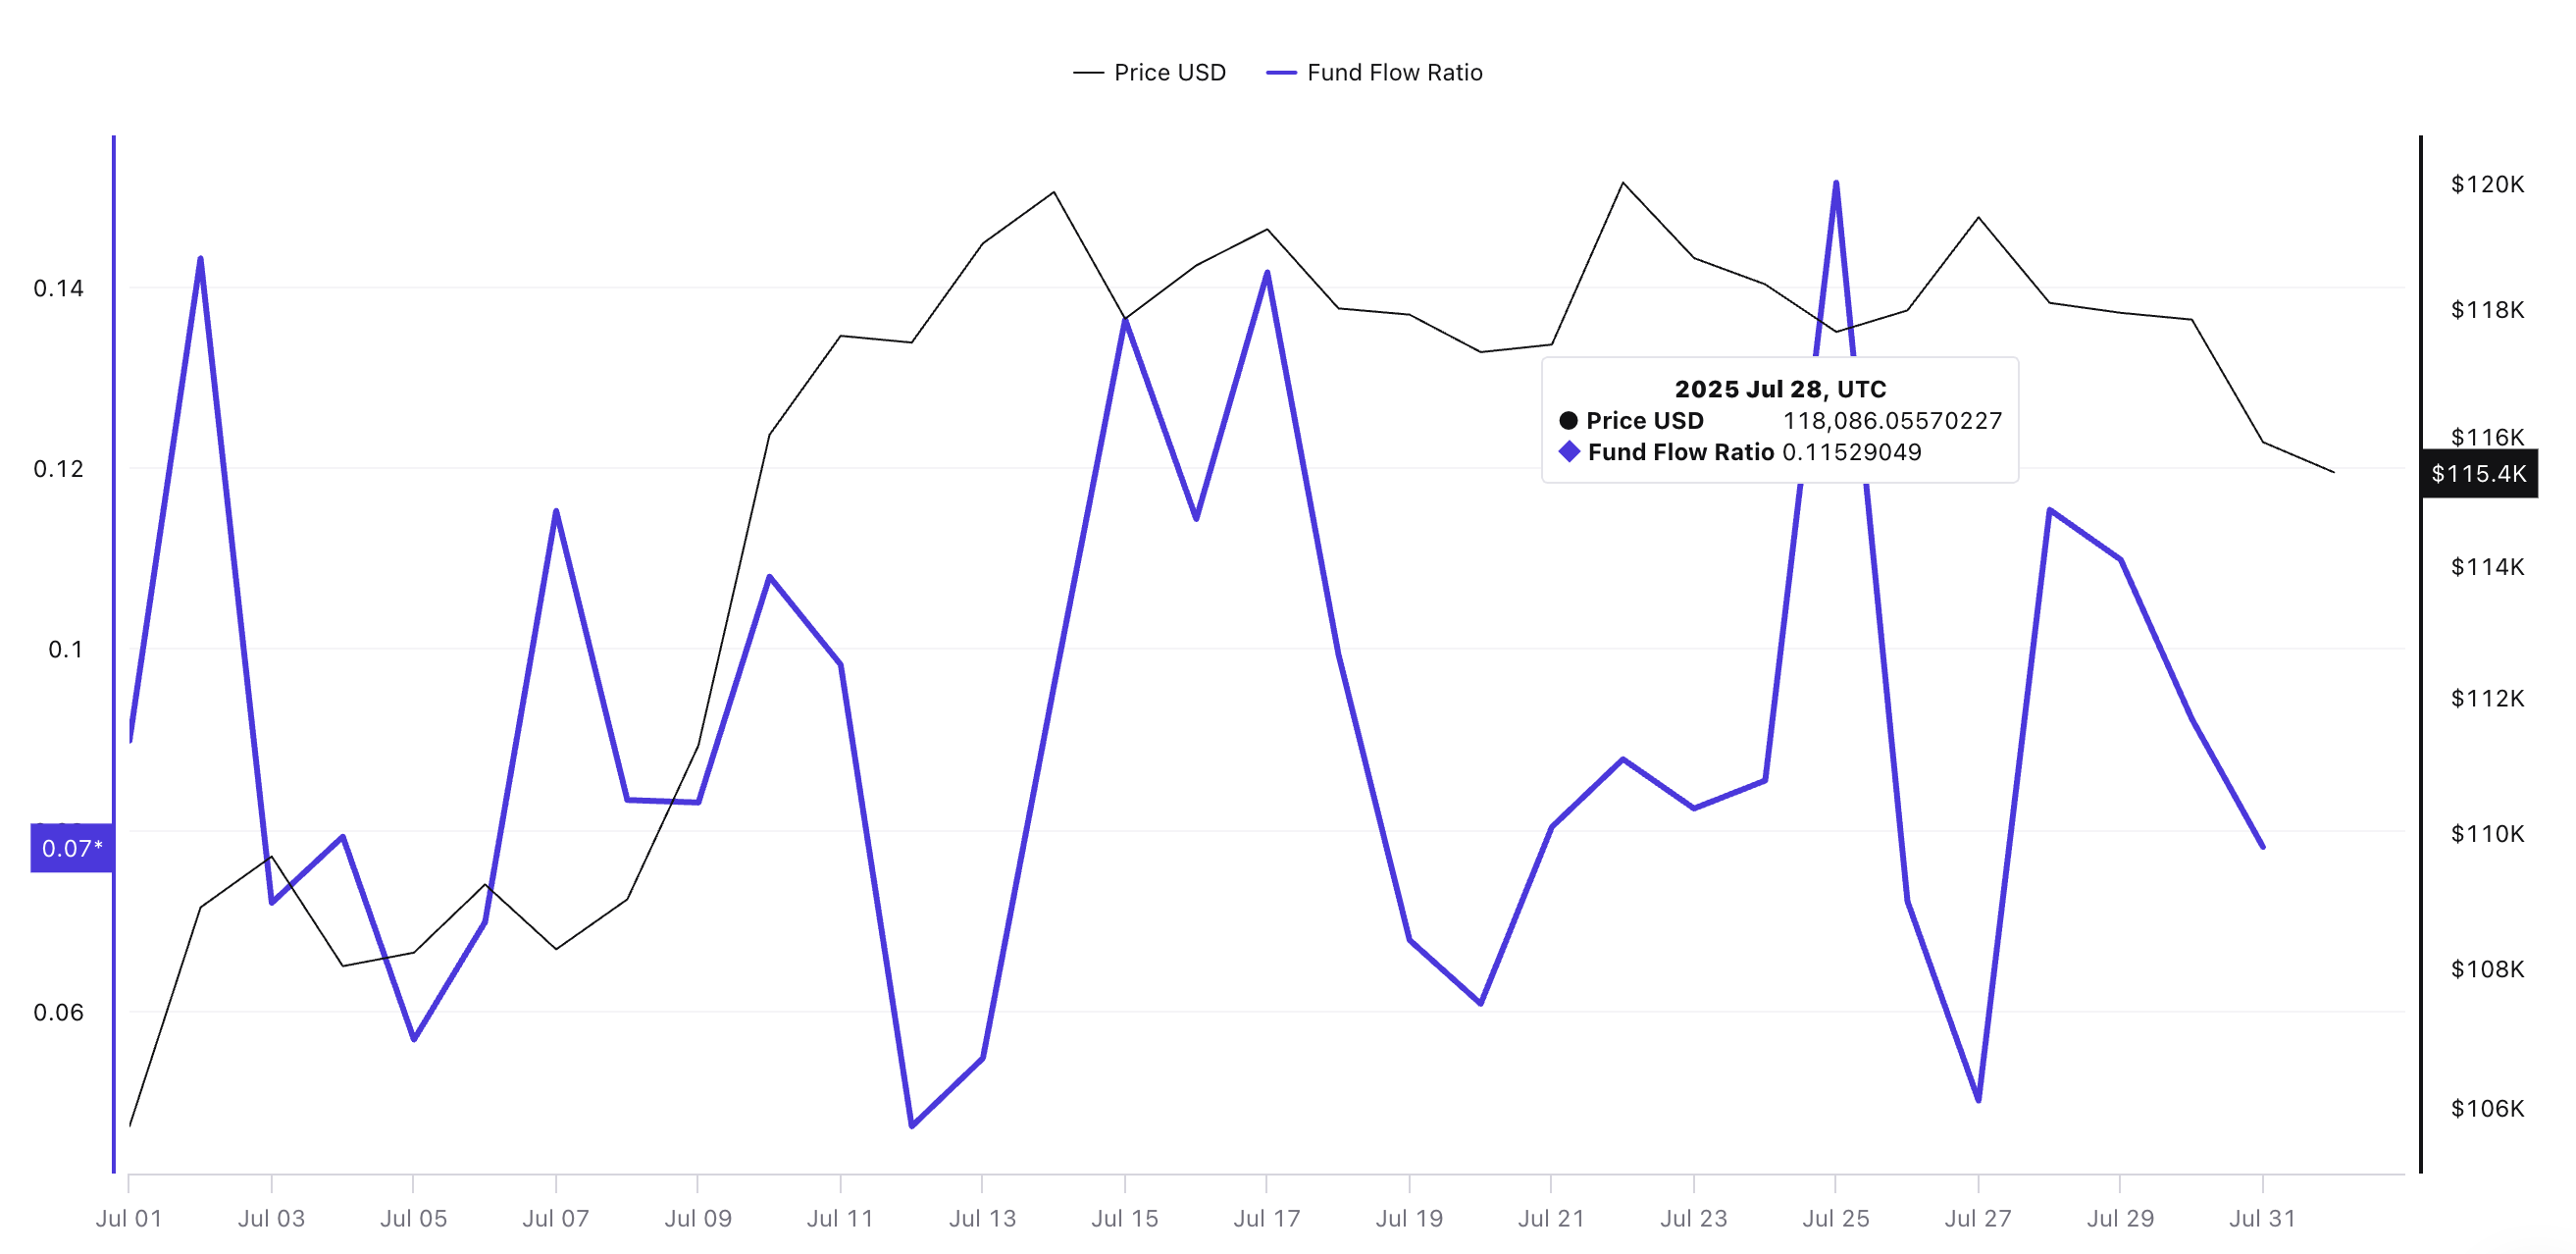 Bitcoin price and fund flow ratio:
Cryptoquant
Over the past two weeks, this ratio has shifted notably:
- Earlier in July, it reached 0.15, matching Bitcoin’s recent peak near $120,000, indicating heightened selling potential.
- By July 28, it had dropped to 0.11, making a lower high. (First lower high since early July, the point where prices surged)
At press time, it has dropped to 0.07. This downtrend in the Fund Flow Ratio suggests that fewer big players are looking to sell. Coins are staying in wallets or moving off exchanges, creating a possible supply squeeze that could help fuel a breakout if buying pressure increases.
For token TA and market updates: Want more token insights like this? Sign up for Editor Harsh Notariya’s Daily Crypto Newsletter here.
CMF Divergence Shows Quiet Accumulation
The Chaikin Money Flow (CMF) is a metric that tracks buying and selling pressure using both price and volume. A higher CMF value indicates strong capital inflows, while a drop signals outflows.
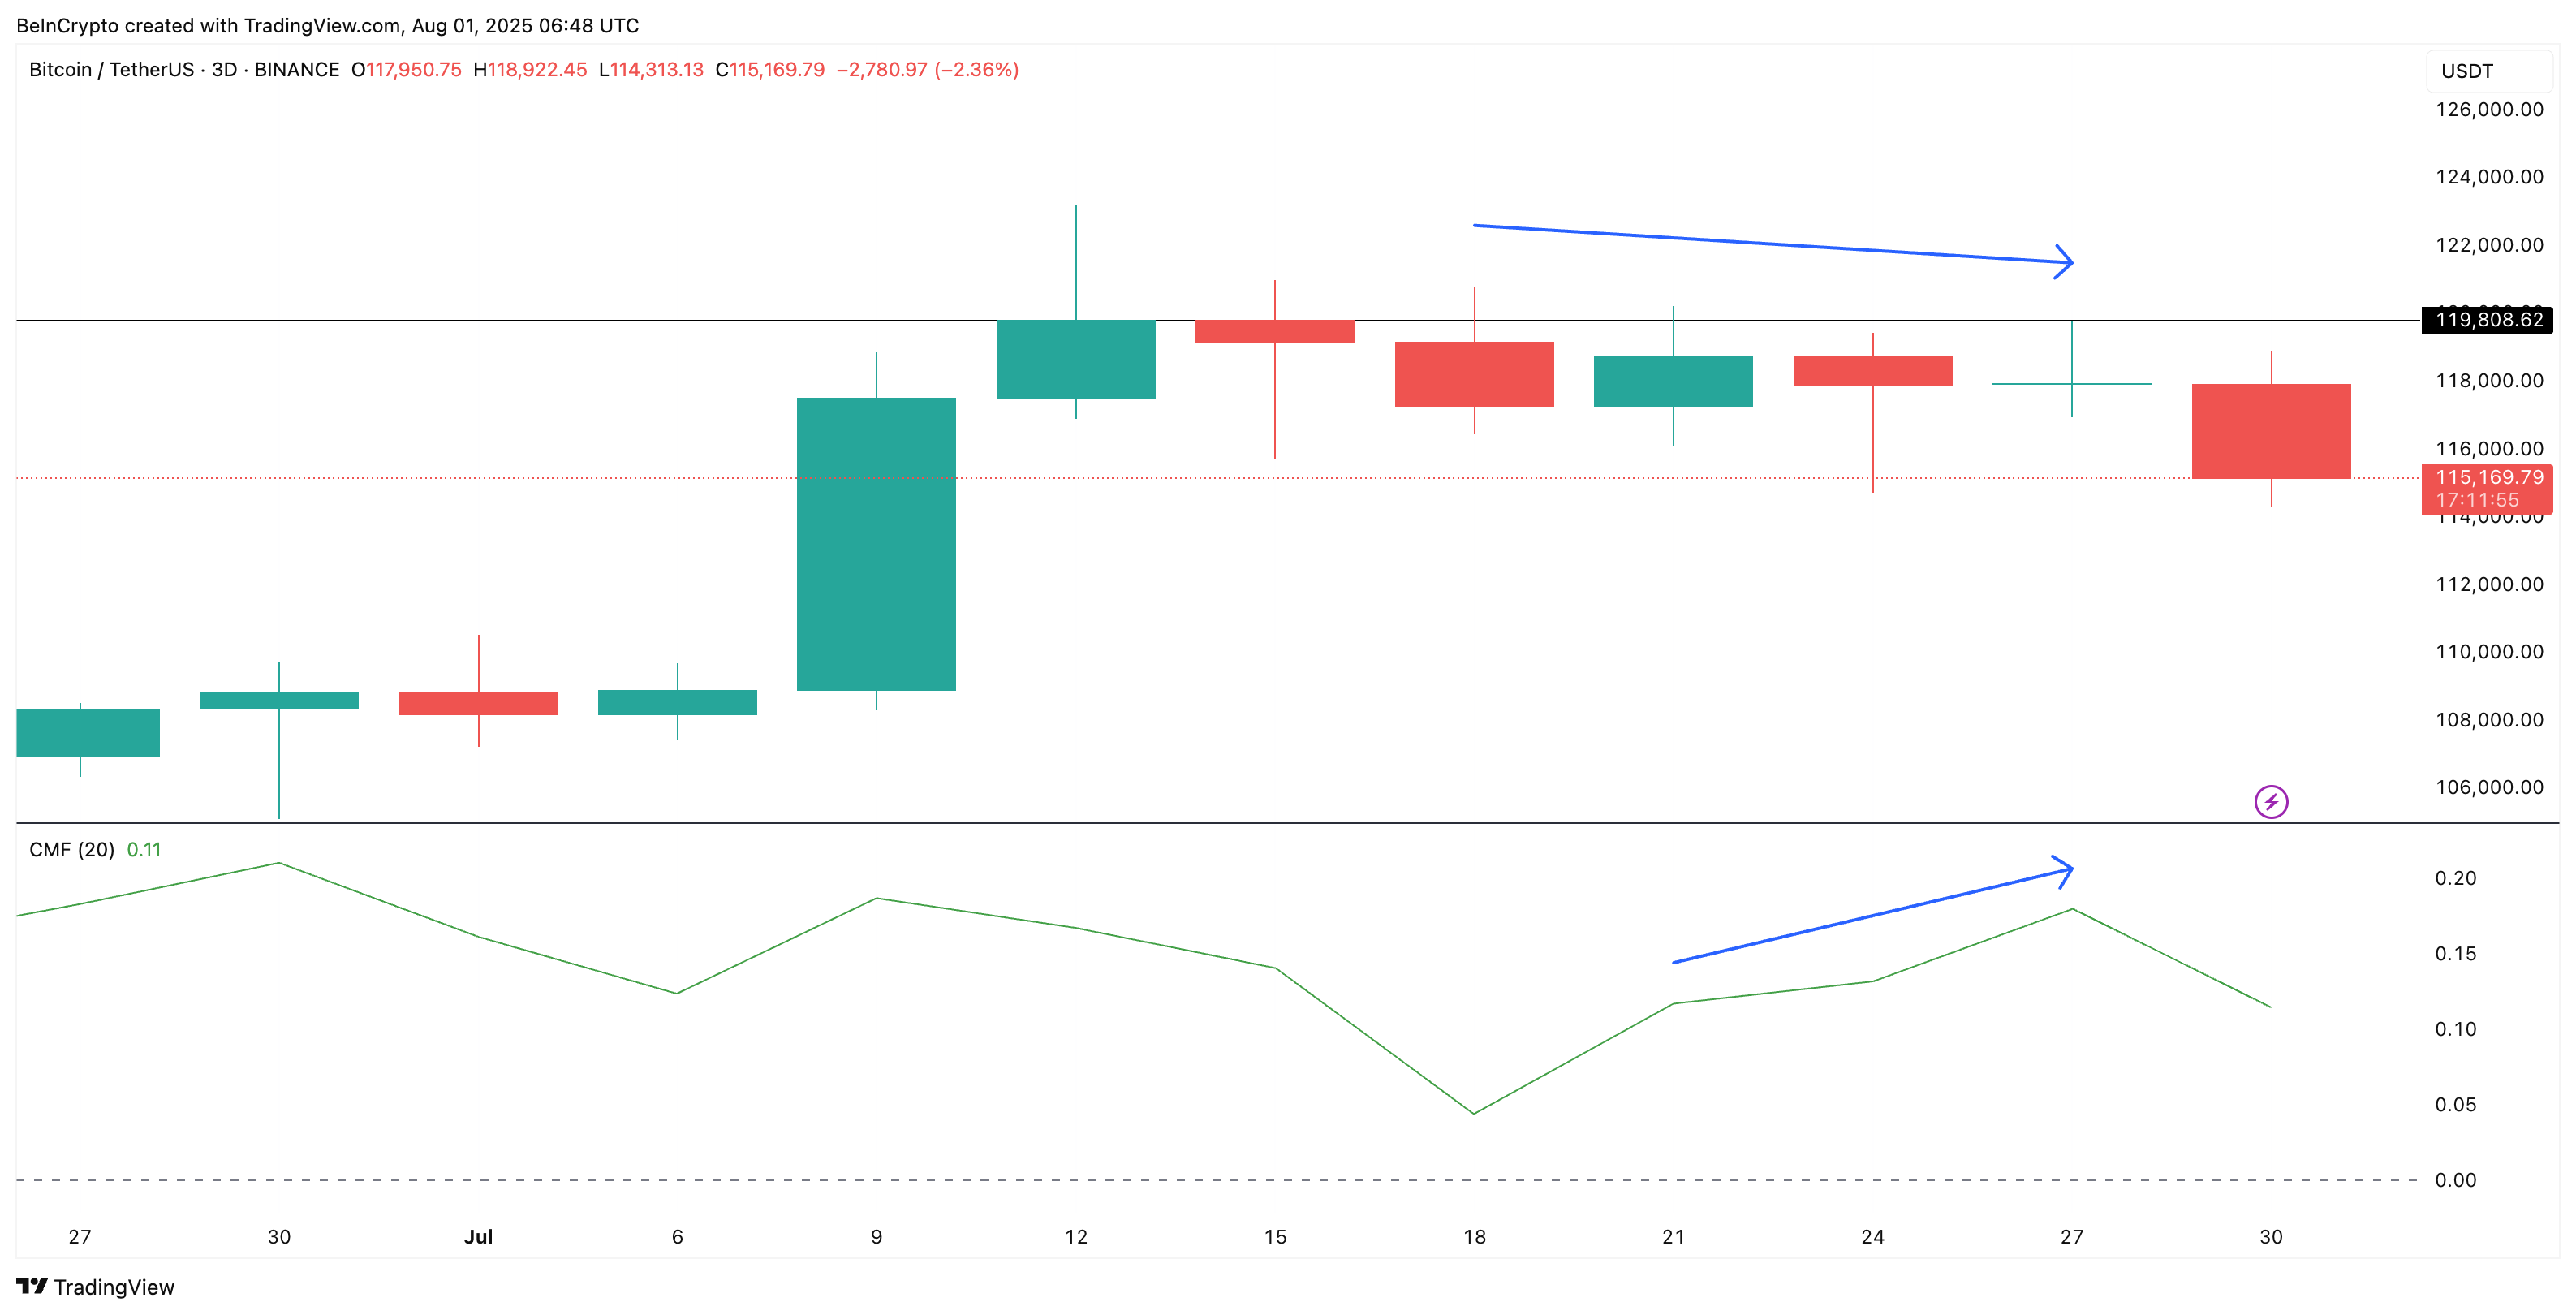 Bitcoin price and CMF divergence (3-day chart):
TradingView
On the 3-day chart, a bullish divergence has formed:
- Price has been making lower highs since mid-July.
- At the same time, CMF has been making higher highs.
This divergence is crucial because it suggests that money is flowing into Bitcoin despite the price dips.
The choice of a 3-day chart is deliberate; it smooths out noise from daily volatility and fake breakouts, giving a clearer view of where big money is positioning. Higher timeframe divergences like this often lead to strong directional moves when resistance breaks.
Currently, the CMF is around the 0.11 mark, and if it moves up from here, forming another higher high, we could get a bullish confirmation for a pattern breakout.
Bullish Pennant Pattern Holds the Key $150,000 Bitcoin Price
The 3-day chart shows a classic pole and pennant structure:
- The pole: A sharp 25% rally earlier this month.
- The pennant: A converging consolidation phase following the surge.
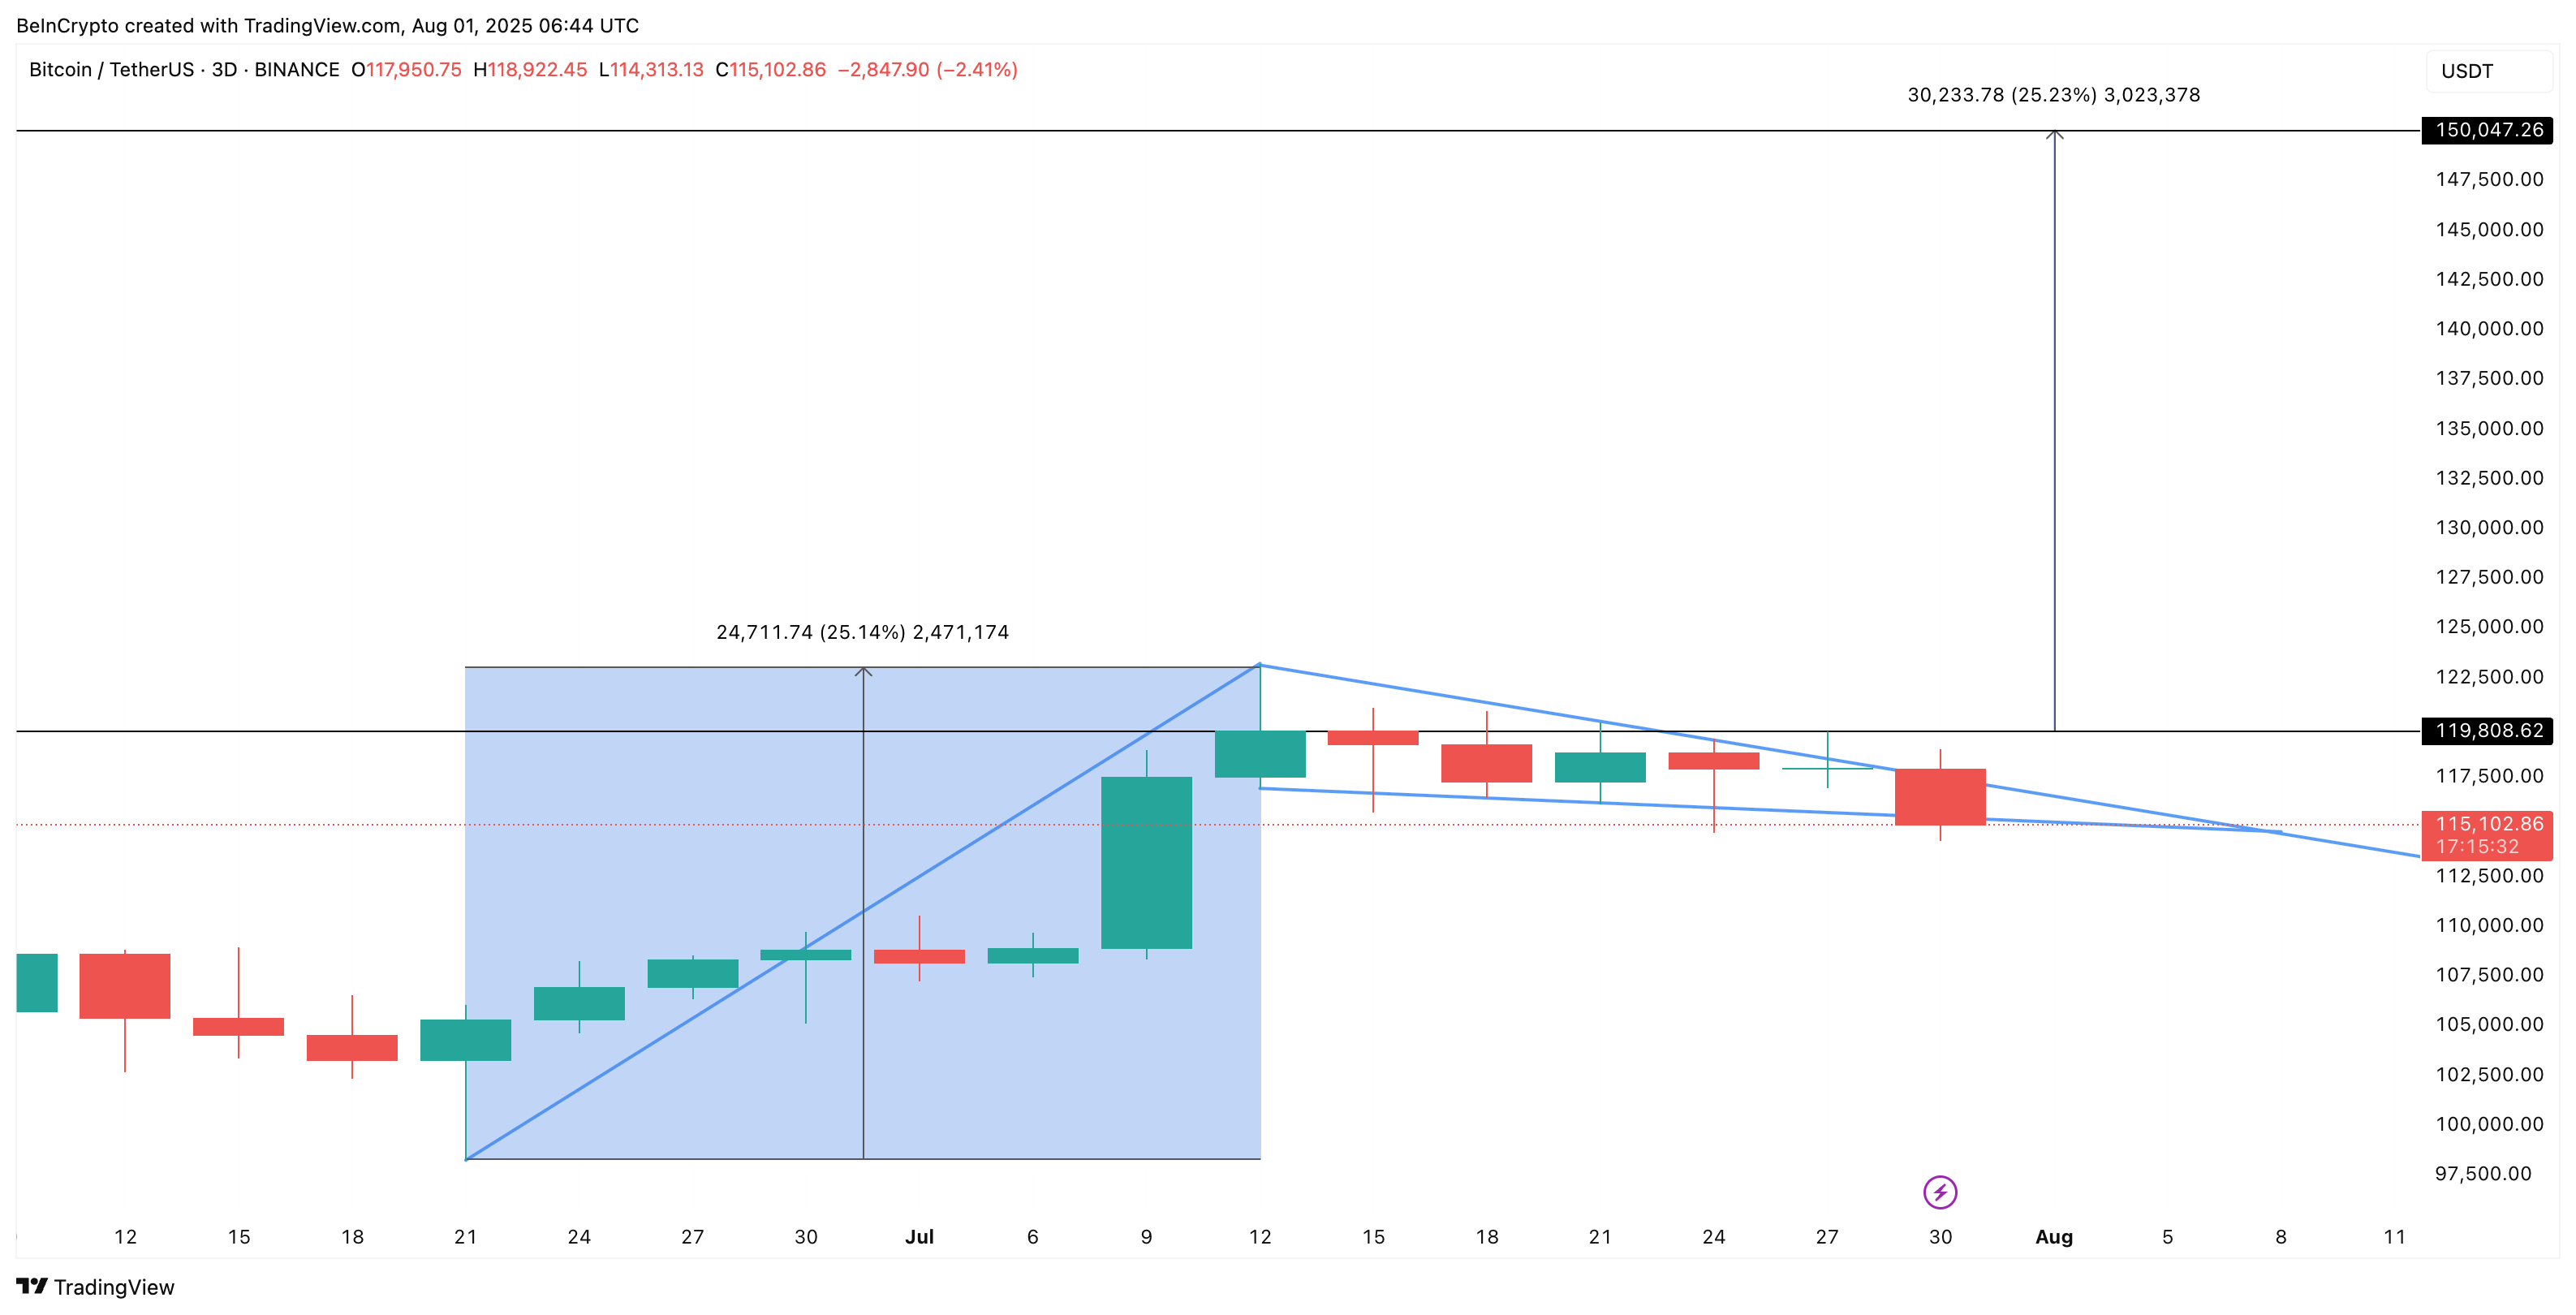 Bitcoin’s pole and pennant structure:
TradingView
This setup typically signals a continuation of the uptrend if resistance breaks. Bitcoin has attempted multiple breakouts, with long wicks above and below trendlines quickly pulled back due to high volatility.
Note: While standard structures and patterns can get invalidated after two false breakouts, pole-based structures have a bigger rope. In most cases, the bullish structure fails if the price drops to close to 50% of the pole’s height. Therefore, the pennant holds for now and remains valid as long as $114,000 support holds.
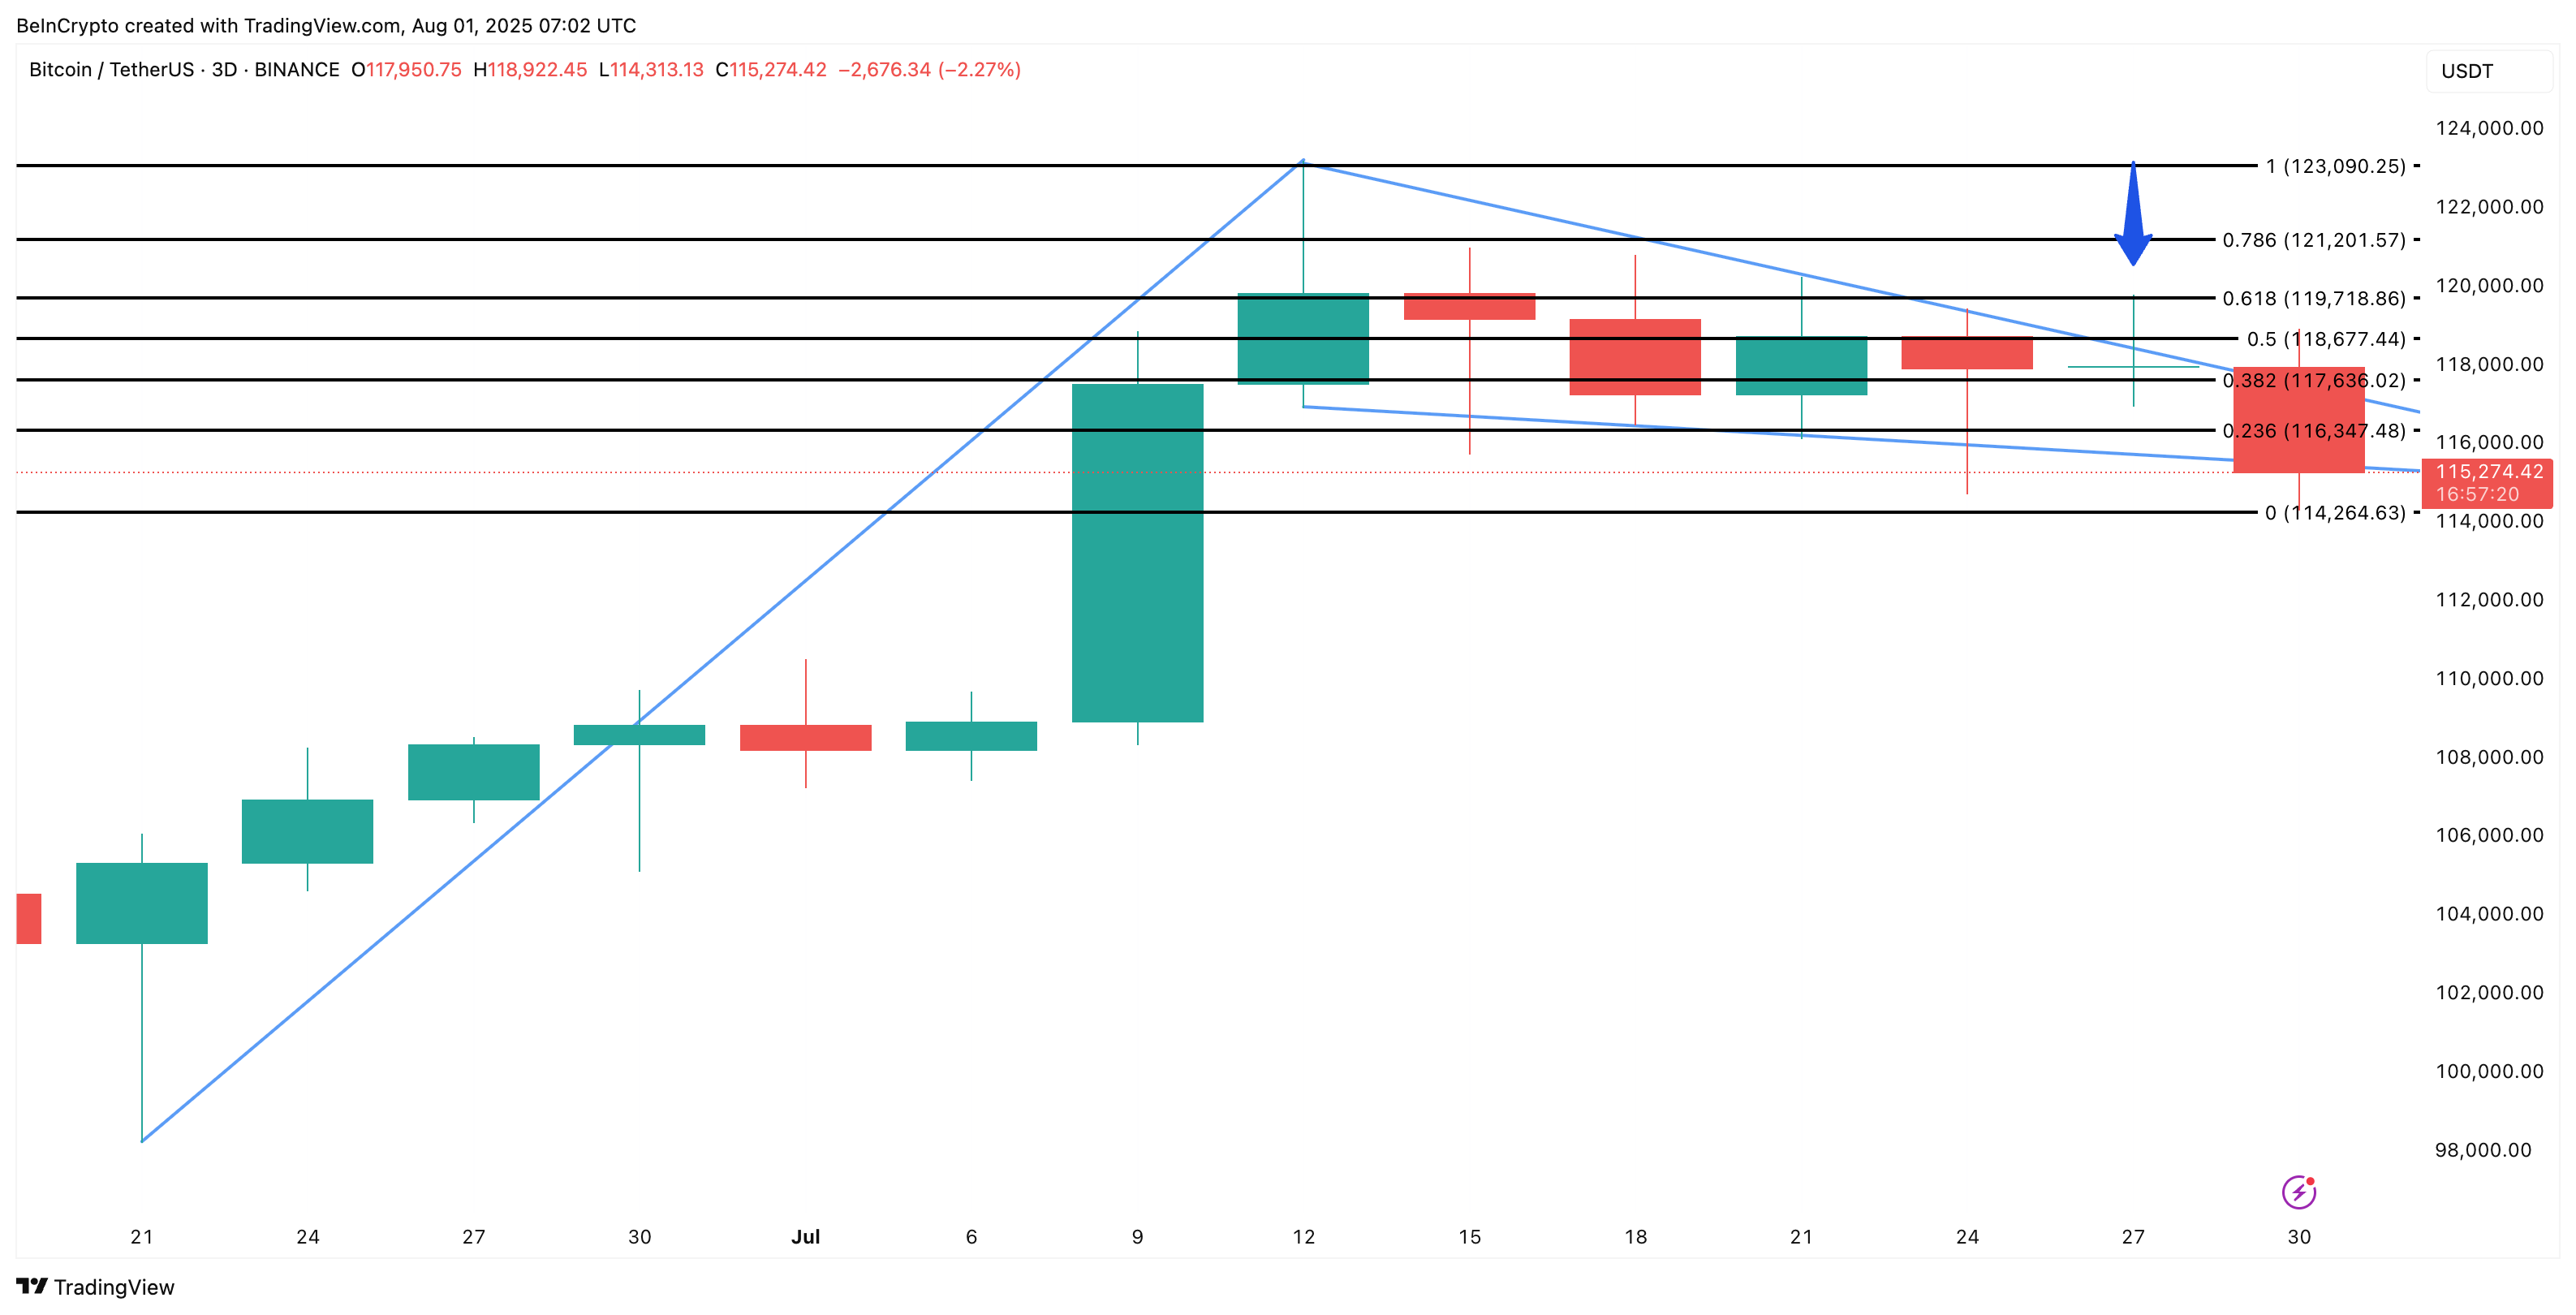 Bitcoin price analysis:
TradingView
A confirmed 3-day full candle close above $119,000 (the highest failed breakout point) would likely trigger the next leg higher. Based on the measured pole move, a 25% breakout from this level could push Bitcoin to around $150,000, aligning with long-term bullish expectations.
Bitcoin’s next big move hinges on a single technical setup. The bullish pennant, backed by reduced exchange outflows and stronger capital inflows on the 3-day CMF, paints a constructive picture for bulls. But it all comes down to price action:
- Above $119,700: Opens the door for a potential surge toward $150,000.
- Below $114,000: The bullish setup fails, and downside risk increases.
Disclaimer: The content of this article solely reflects the author's opinion and does not represent the platform in any capacity. This article is not intended to serve as a reference for making investment decisions.
You may also like
The script at the end of 2018: The Federal Reserve continued to raise interest rates, US stocks plunged 20% from the September highs, forcing the Federal Reserve to "pivot" in January.
Goldman Sachs' head of trading believes the current US stock market is repeating the scenario of late 2018, with monetary tightening and equity market pressure. The Goldman Sachs Financial Conditions Index has tightened by about 8 points in two weeks, reaching the highest level in a year. The selloff has broadened from tech stocks to defensive sectors. Gold and equities are declining simultaneously, possibly indicating investors are selling assets to raise cash, making gold a key indicator for observing liquidity stress.

Goldman Sachs Trader “Revisits the 2018 Playbook”: Still Clearly Remembers “On December 24th, Clients Asked Why the Market Dropped So Much—And I Had No Idea”
Brian Garrett pointed out that the current adjustment in the US stock market is similar to the sharp decline in Q4 2018: the S&P 500 has already experienced 42% of the corresponding drop, and the VIX is approaching its peak just before Christmas. If history repeats itself, the bottom of this cycle may appear in January next year. However, the credit market and Federal Reserve policy have yet to provide clear signals of a bottom.
Anthropic (ANT.US) nearly “broke issue price,” but Claude knocks on the doors of “the highest peak in mathematics”! 17 million lines of Lean code used to write a candidate proof for the Riemann Hypothesis
On November 20th, Eastern Time, on its second day of trading, Anthropic's intraday price dropped to a low of $83.05, just 5 cents above the offering price of $83, and finally closed at $88.91, a decline of 8.50%. On the same day, the company's mathematician Levant Alperg announced on his personal website that he and Claude had found a candidate proof for the Riemann hypothesis, which has puzzled the mathematics community for 167 years, and released about 17 million lines of Lean formalized code.

As US stocks plummet, the parent company of GTA 6 rises against the market! First-day sales hit a record $3.79 billion; Wall Street shifts focus to next-generation GTA Online.
According to Rentrak data, the global box office of "Grand Theft Auto VI" has also surpassed that of "Avengers: Endgame," the highest-grossing film of all time, which has a global box office of approximately $2.94 billion.

Crypto prices
More


