
What to Expect From Solana (SOL) in August?

After a strong rally in July, Solana's momentum is waning as the price drops and network activity slows. August may bring further challenges unless sentiment improves.
Solana reasserted its dominance as one of the resilient large-cap altcoins, riding on the wave of July’s broader market rally. Closely tracking Bitcoin’s upward momentum, SOL surged past the $200 mark to hit a cycle high of $206.19 on July 22.
This price rally triggered a spike in on-chain activity across the Solana ecosystem, pushing up its DeFi total value locked (TVL), DEX trading volumes, and overall chain revenue. However, signs of exhaustion are starting to show. SOL has slipped back below the $190 threshold, facing selling pressure that suggests investors may be rotating out after locking in July’s gains.
SOL’s Rally Powers Network Surge—But Can the Momentum Hold in August?
Between July 1 and July 22, SOL maintained a steady rally, pushing its value up by 40%. As SOL’s price surged, the on-chain value of tokens locked in lending pools and vaults across the Solana network rose, boosting the network’s TVL.
At press time, Solana’s TVL sits at $9.85 billion, a 14% increase over the past month.
For token TA and market updates: Want more token insights like this? Sign up for Editor Harsh Notariya’s Daily Crypto Newsletter .
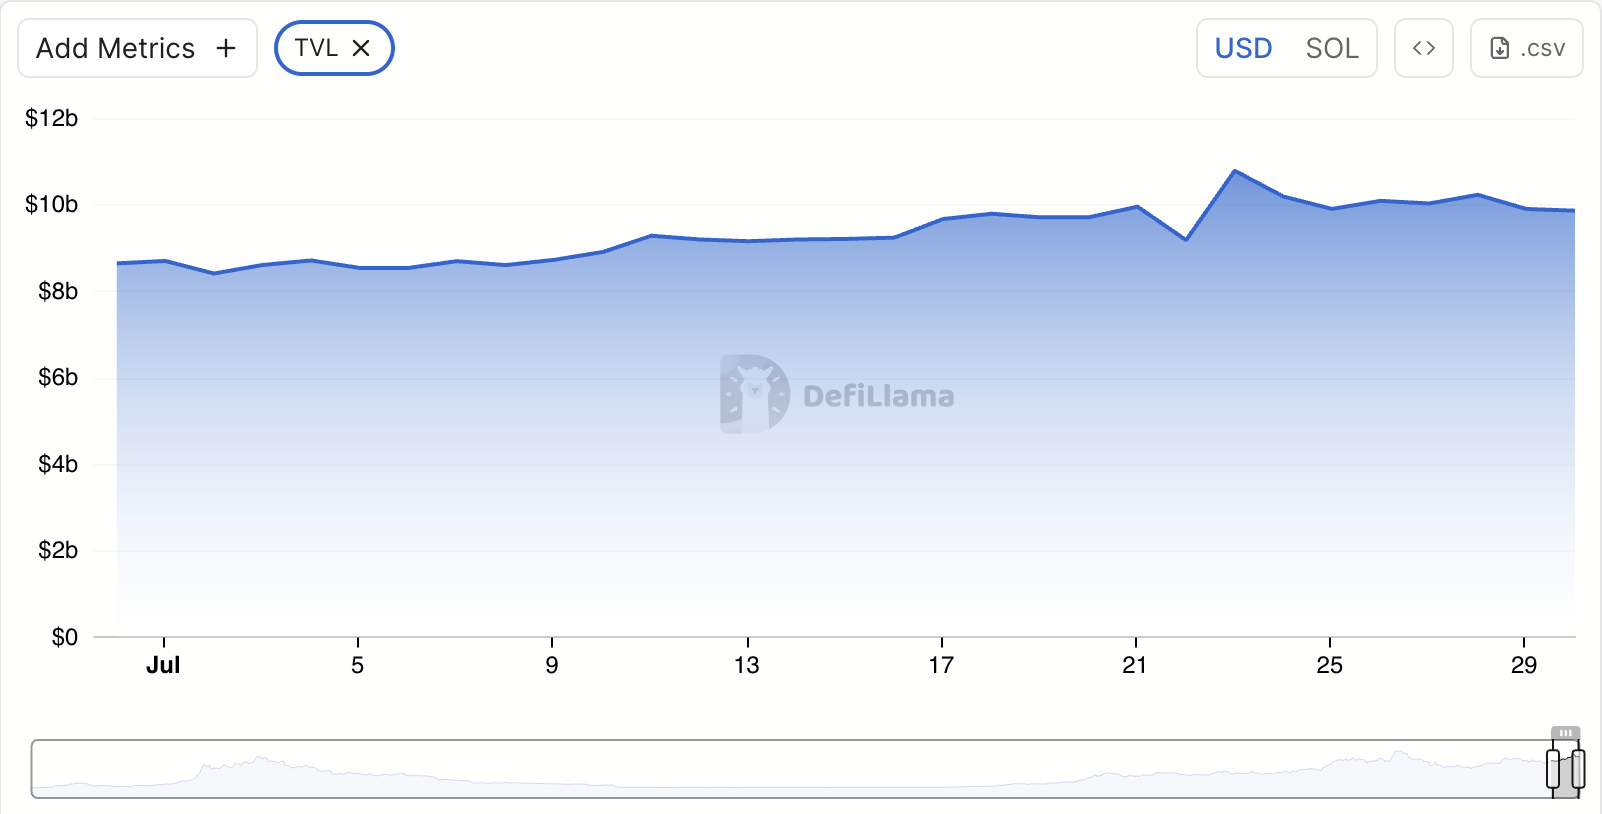 Solana TVL. Source:
As demand for SOL climbed during that period, trading activity across DEXes on the network also climbed. Over the last 30 days, DEX volume has jumped by 30%, with trade volumes worth more than $82 billion recorded so far this month alone.
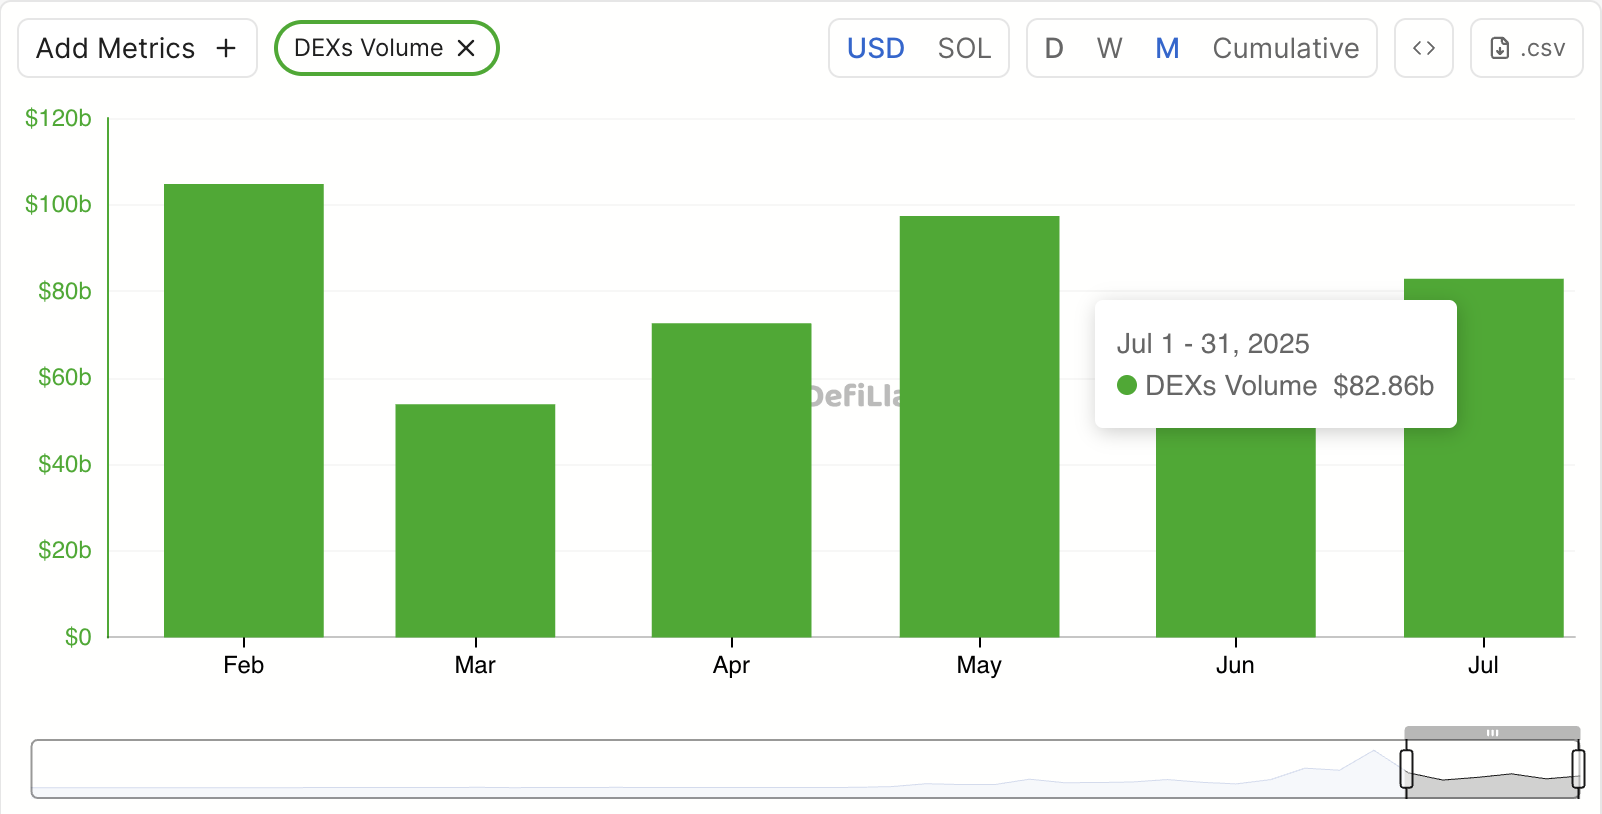 Solana Monthly DEX Volume. Source:
This spike in activity translated into higher network revenue. According to DefiLlama, Solana has generated $4.3 million in revenue since the beginning of July, marking a 13% increase from the $3.81 million recorded in June.
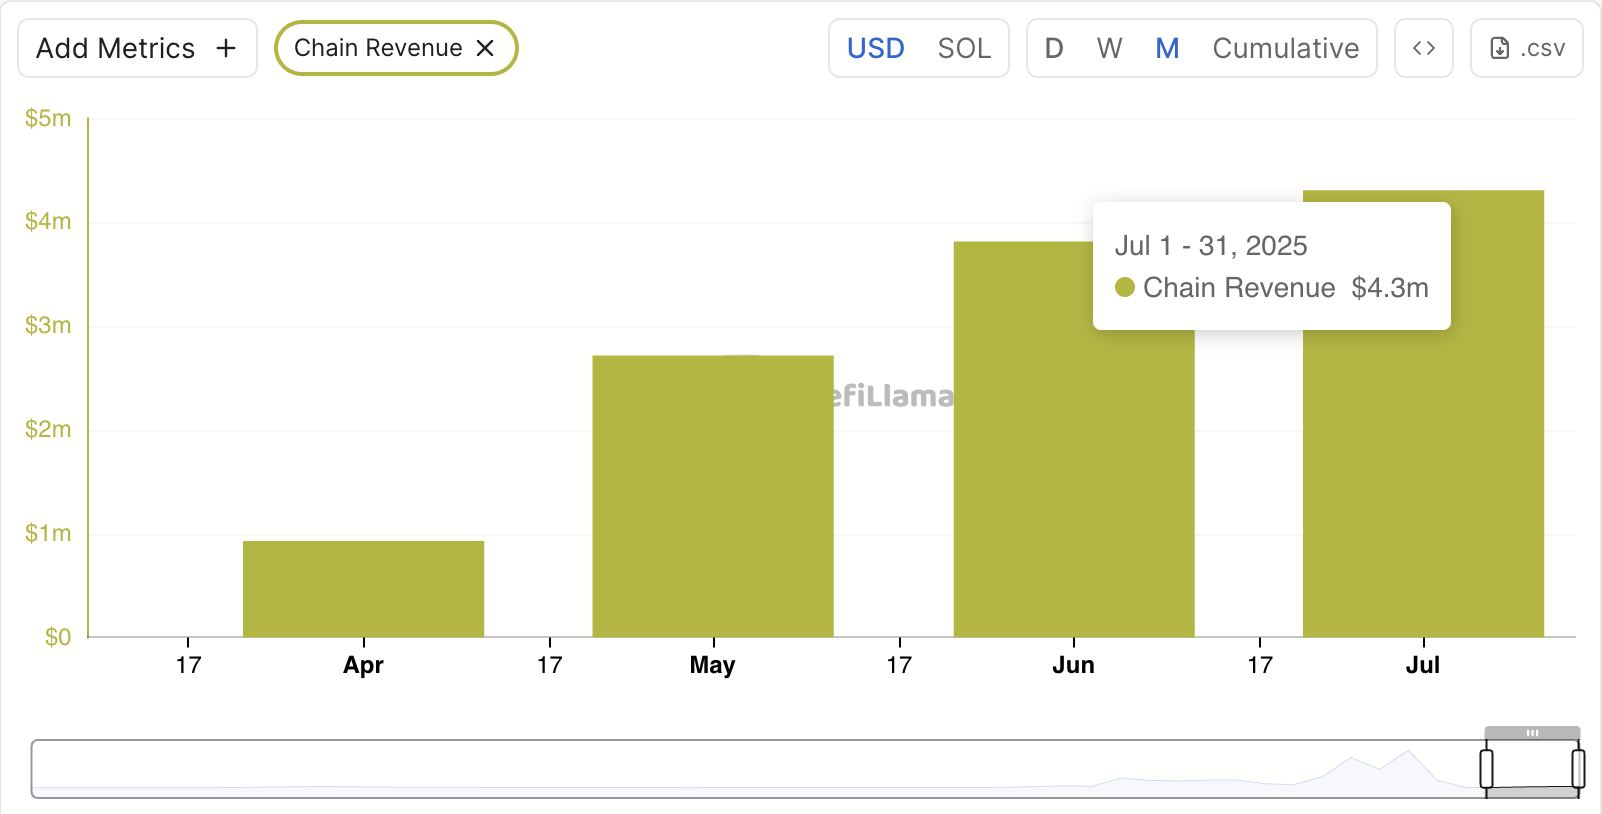 Solana Monthly Revenue. Source:
Solana’s Ecosystem Cools as Price Dips and User Activity Shrinks
However, as we approach August, momentum is fading on the Solana network. At press time, SOL has dipped to around $180, and signs of weakening demand across the network are emerging.
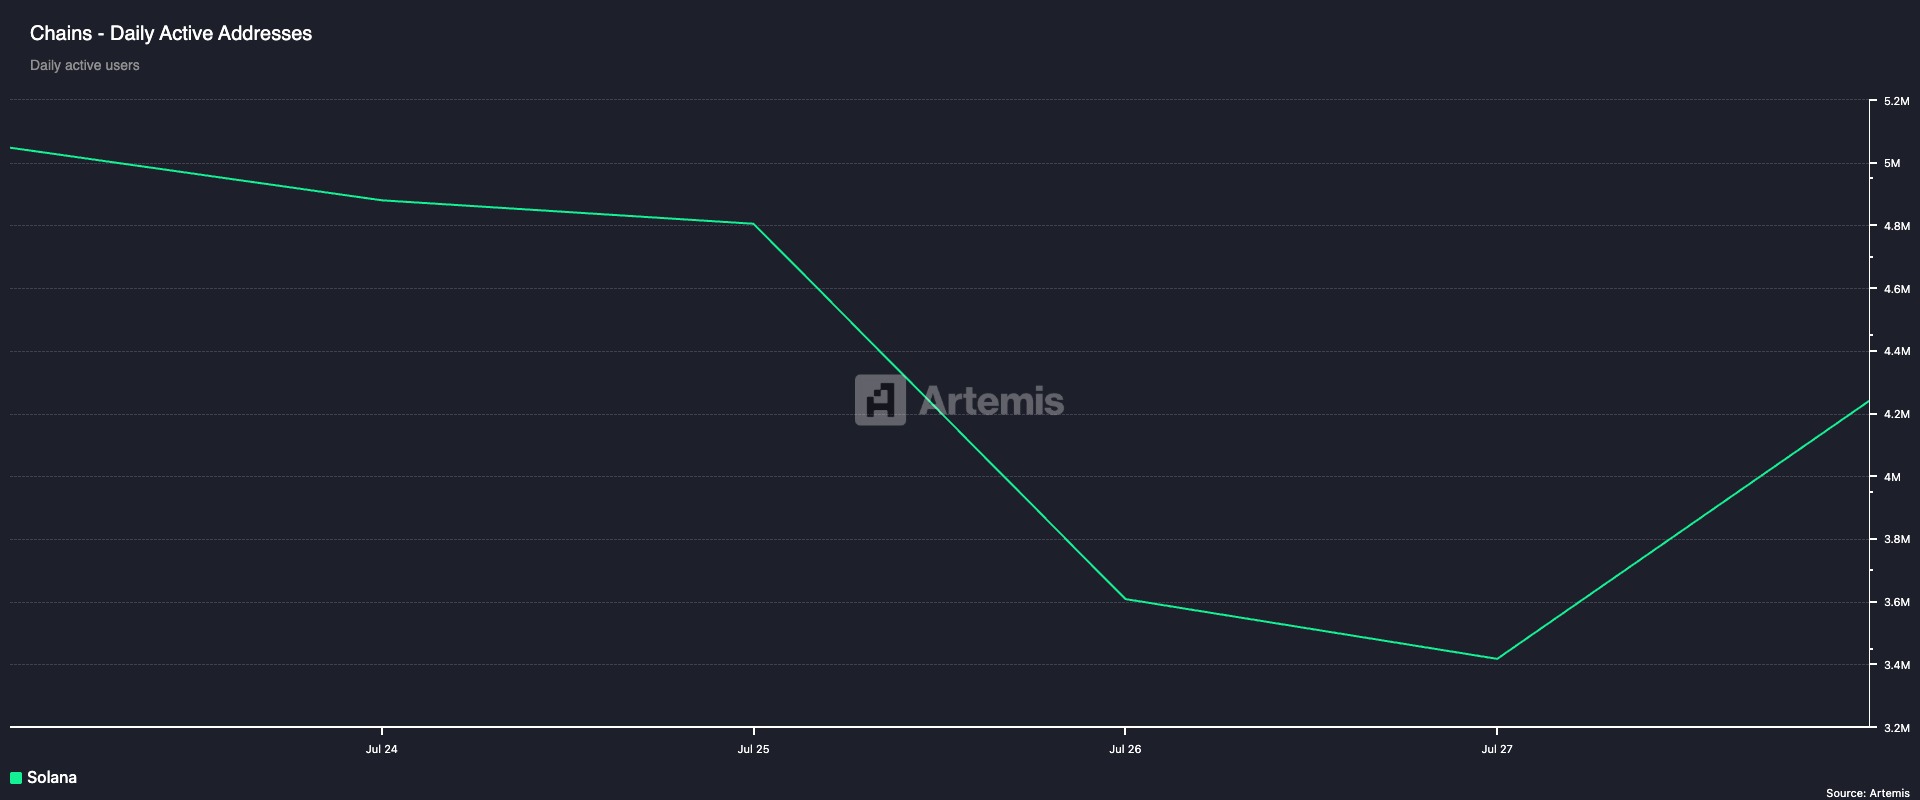 Solana Daily Active Address. Source:
For example, the daily active address count on Solana has plummeted in the past seven days. According to Artemis, it has declined by 16% during that period.
A drop in a network’s daily active address count signals reduced user engagement and on-chain activity. Fewer active addresses reflect a slowdown in transactions, dApp usage, and overall demand for the network’s services.
In Solana’s case, the 16% decline suggests waning participation, which hints at a broader cooldown in network growth as the new trading month commences.
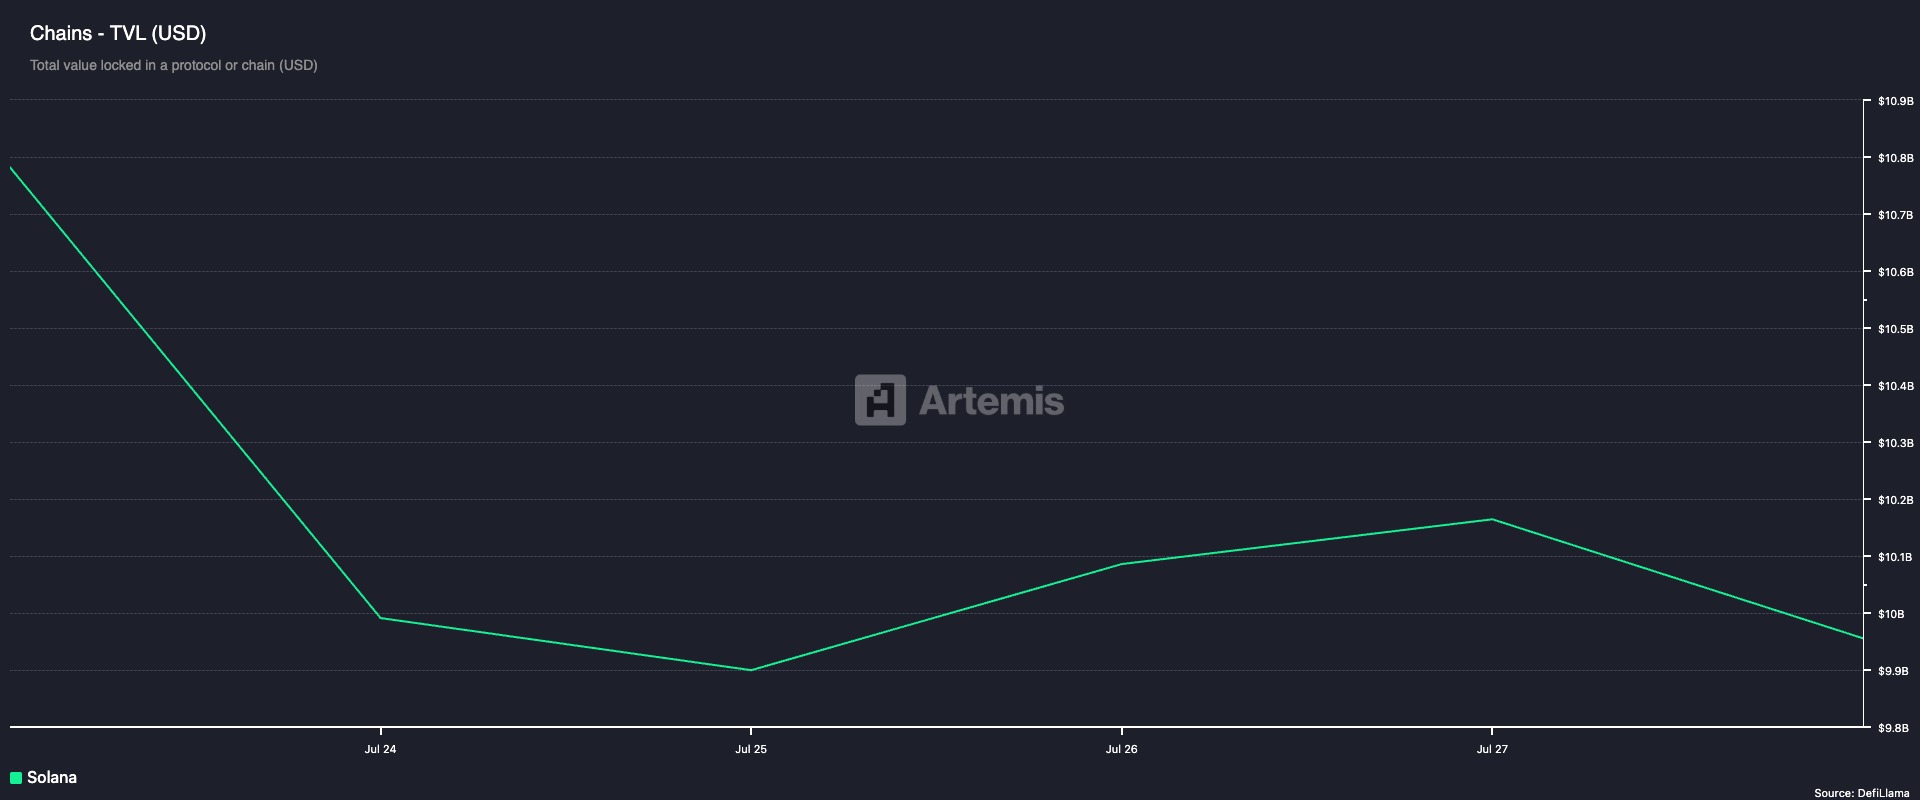
As activity across the network dips, Solana’s DeFi TVL has also begun to pull back. Over the past week, TVL has fallen by 8%.
 Solana TVL. Source:
This signals that users are either withdrawing assets from the DeFi protocols on the network or the value of those assets is declining due to market movements.
Solana Bears Circle as Price Nears Breakdown Point
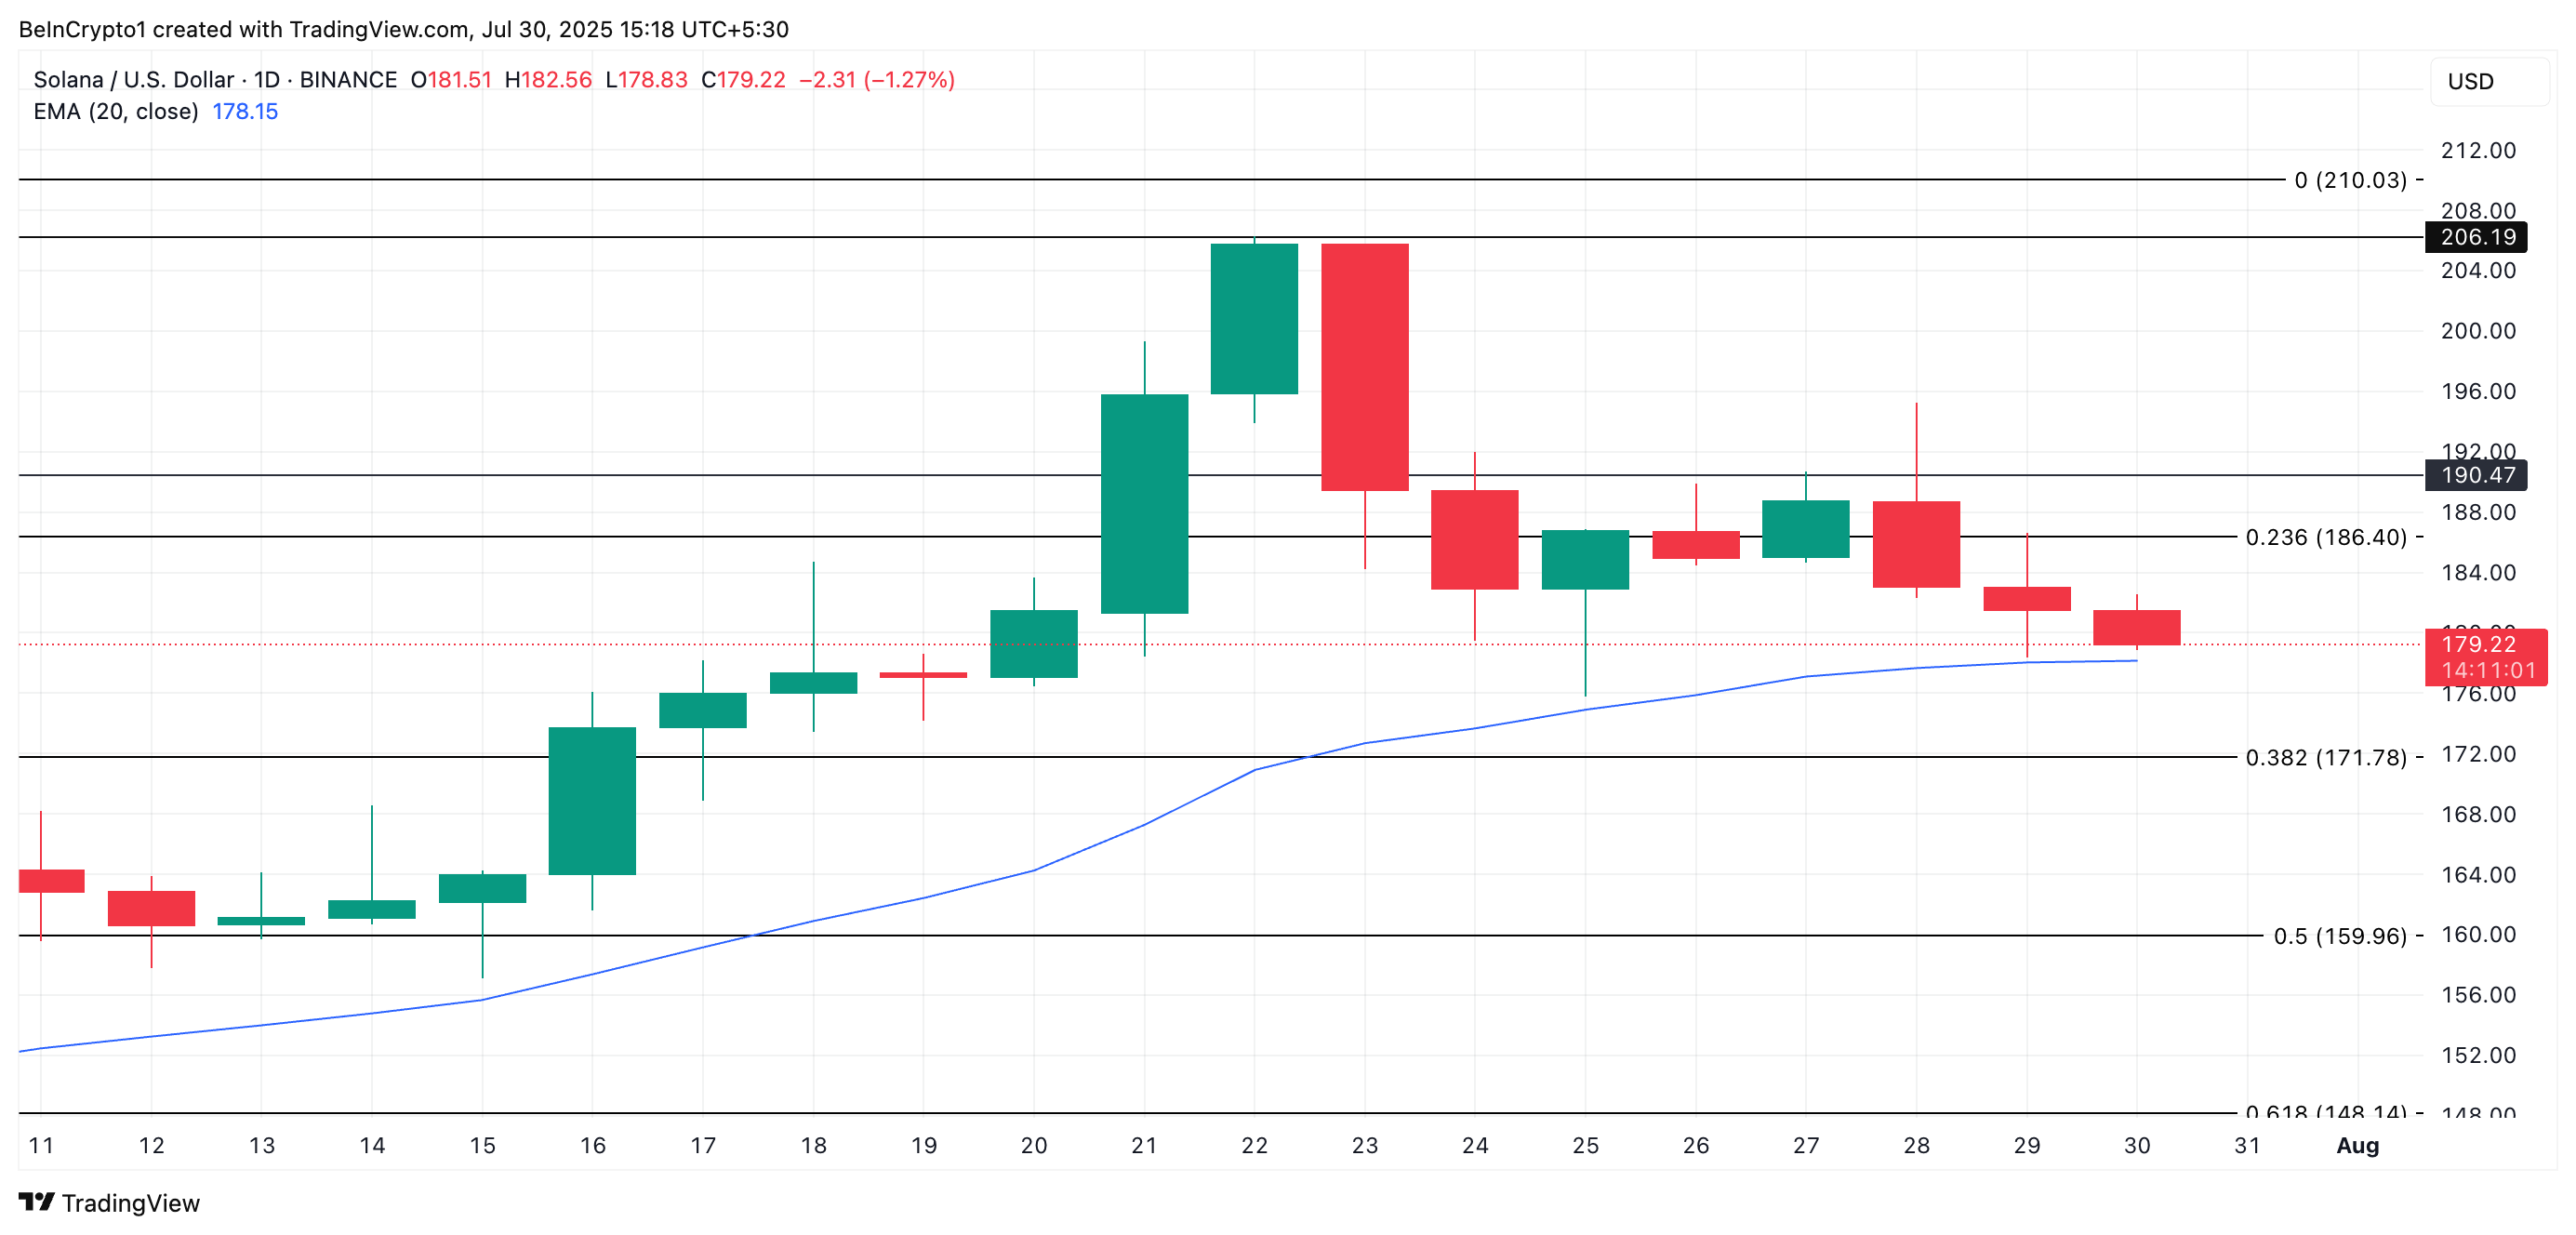
SOL’s decline over the past few days has pushed its price dangerously close to its 20-day exponential moving average (EMA), which forms a critical dynamic support line at $178.25. For context, SOL currently trades at $180.51.
The 20-day EMA measures an asset’s average trading price over the past 20 trading days, giving more weight to recent prices. A decisive break below this level could potentially open the door for further downside, especially if accompanied by falling volume and network activity.
In this case, SOL’s price could fall to $171.78.
 SOL Price Analysis. Source:
On the other hand, if market sentiment improves, this bearish outlook will be invalidated. In that scenario, the coin’s price could rally to $186.40. A successful breach of this level could propel the coin toward $190.47.
Disclaimer: The content of this article solely reflects the author's opinion and does not represent the platform in any capacity. This article is not intended to serve as a reference for making investment decisions.
You may also like
“The Chinese Buffett” Duan Yongping's US stock Q3 holdings revealed! Slashed Nvidia, increased Pinduoduo and Tesla, Apple and Berkshire remain core holdings
The investment firm H&H International Investment, LLC, owned by Duan Yongping, who is known as the "Warren Buffett of China," recently submitted its 13F report on holdings in the US stock market for the third quarter ending September 30, 2026.

Blackstone Q3 Holdings: LNG exporter Cheniere Energy (CQP.US) becomes the absolute core, new position Jersey Mike (JMKE.US) ranks as the third largest holding.
Blackstone Group's Q3 total holdings market value reached $34.7 billion, down 11.70% quarter-on-quarter; JMKE.US became the third largest holding after its newly established position.
Bank of America Q3 Holdings: Nvidia (NVDA.US) remains top, Apple (AAPL.US) reduced, JPMorgan Chase (JPM.US) cut by nearly 30%
According to disclosures from the U.S. Securities and Exchange Commission (SEC), Bank of America (BAC.US) has submitted its third-quarter holdings report (13F) as of September 30, 2026.
Wells Fargo Q3 Holdings: AstraZeneca (AZN.US) Surpasses Apple (AAPL.US) as Top Position, Increases Holdings in Microsoft (MSFT.US) and Nvidia (NVDA.US)
Wells Fargo's total holdings in the third quarter reached $640 billion, up 3.23% quarter-on-quarter; AstraZeneca (AZN.US) became the largest holding, with 551 new positions and 514 liquidated positions, and options adjustments were active.

Crypto prices
More


