
New Day, New Bitcoin All-Time High: What’s Next For BTC Price?

BTC price trades at $120,266 after a new ATH. With low SOPR and rising volume, Bitcoin could push toward $127,000 if $121,000 breaks.
Bitcoin has once again hit a new all-time high, briefly moving above $121,000 before stabilizing near $120,500. The price is up 2.54% today, continuing a strong trend that started earlier this month. But is this rally sustainable, or nearing a slowdown?
Key indicators suggest the trend might not be done just yet.
Holders Aren’t Taking Profits Yet
The adjusted Spent Output Profit Ratio (aSOPR) currently sits at 1.03, well below the early July 2025 levels, where aggressive profit-taking pushed the ratio much higher. This time, despite Bitcoin making new highs, traders appear to be holding instead of selling.
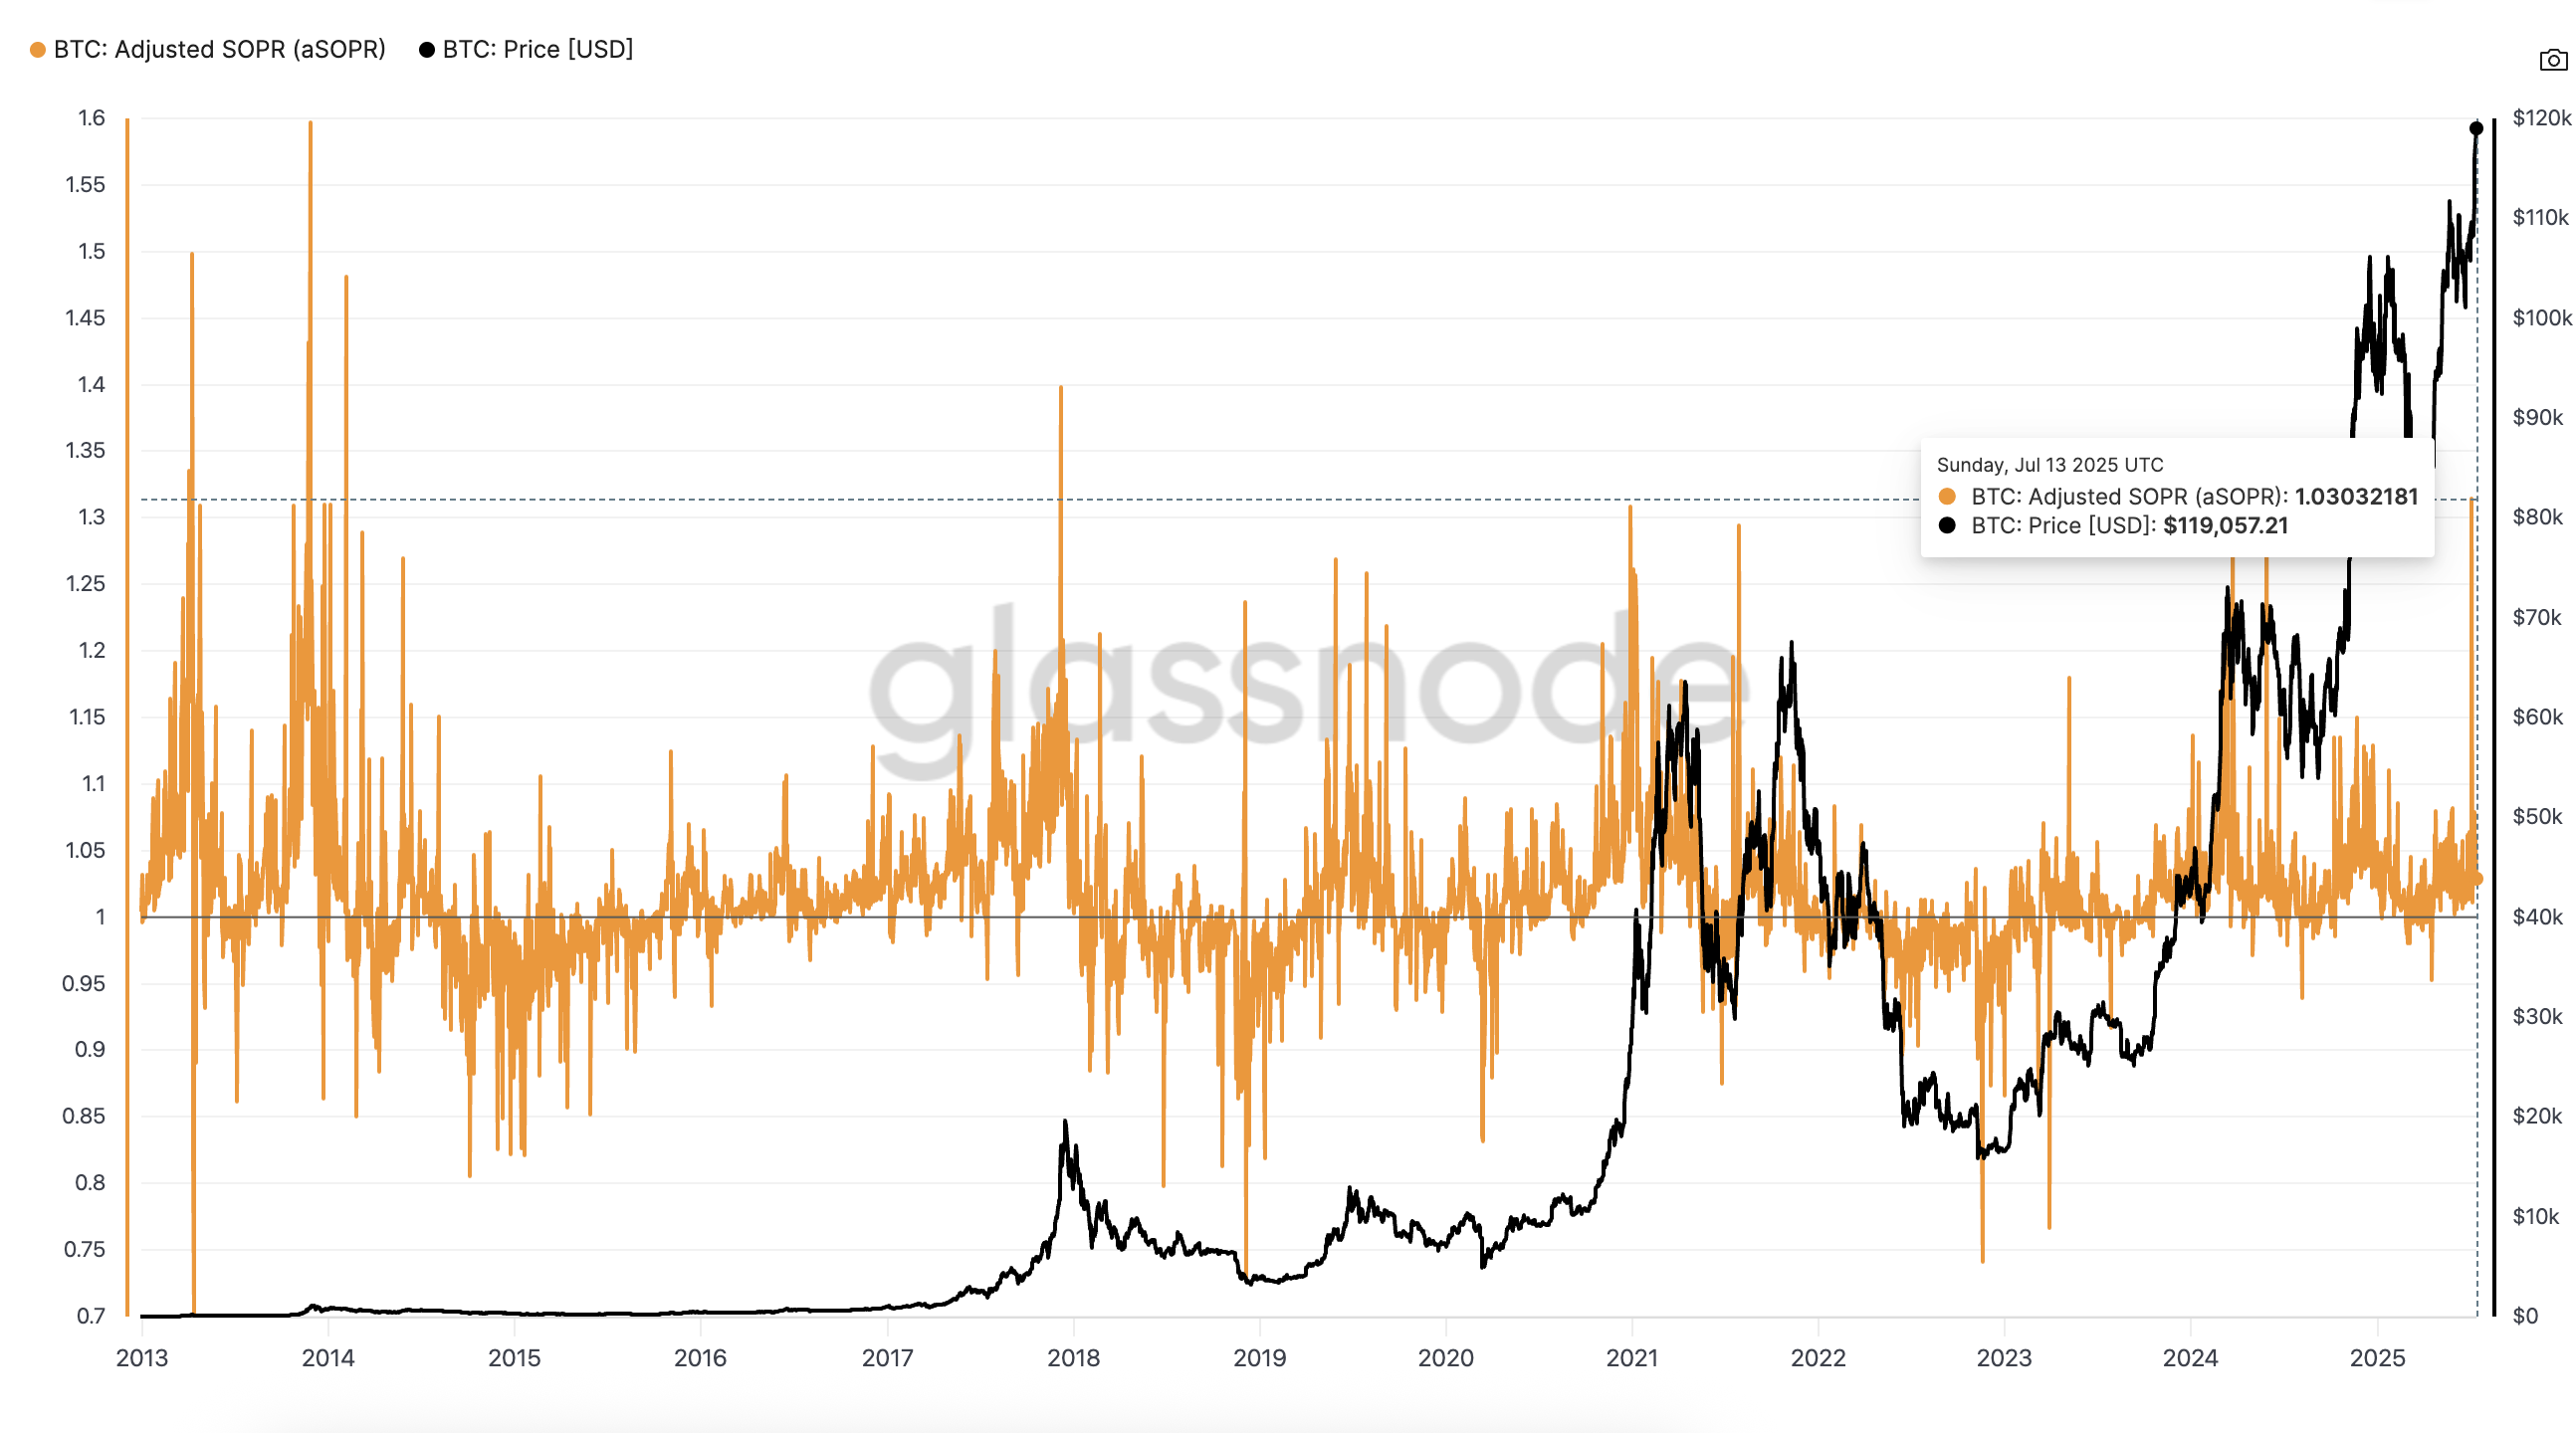 BTC price and adjusted SOPR:
Glassnode
This means most coins being moved on-chain are not being sold for massive gains, which suggests the rally is not overheated.
SOPR shows whether BTC moved on-chain is being sold at a profit (>1) or at a loss (<1). Adjusted SOPR fine-tunes the metric and filters out short-term internal transactions to show whether BTC moved on-chain is being sold at a profit or loss.
Volume is Supporting the Rally
On-Balance Volume (OBV) is moving up in tandem with Bitcoin’s price, a key sign that buying volume is keeping pace with the rally. There’s no visible divergence, no breakdown in momentum.
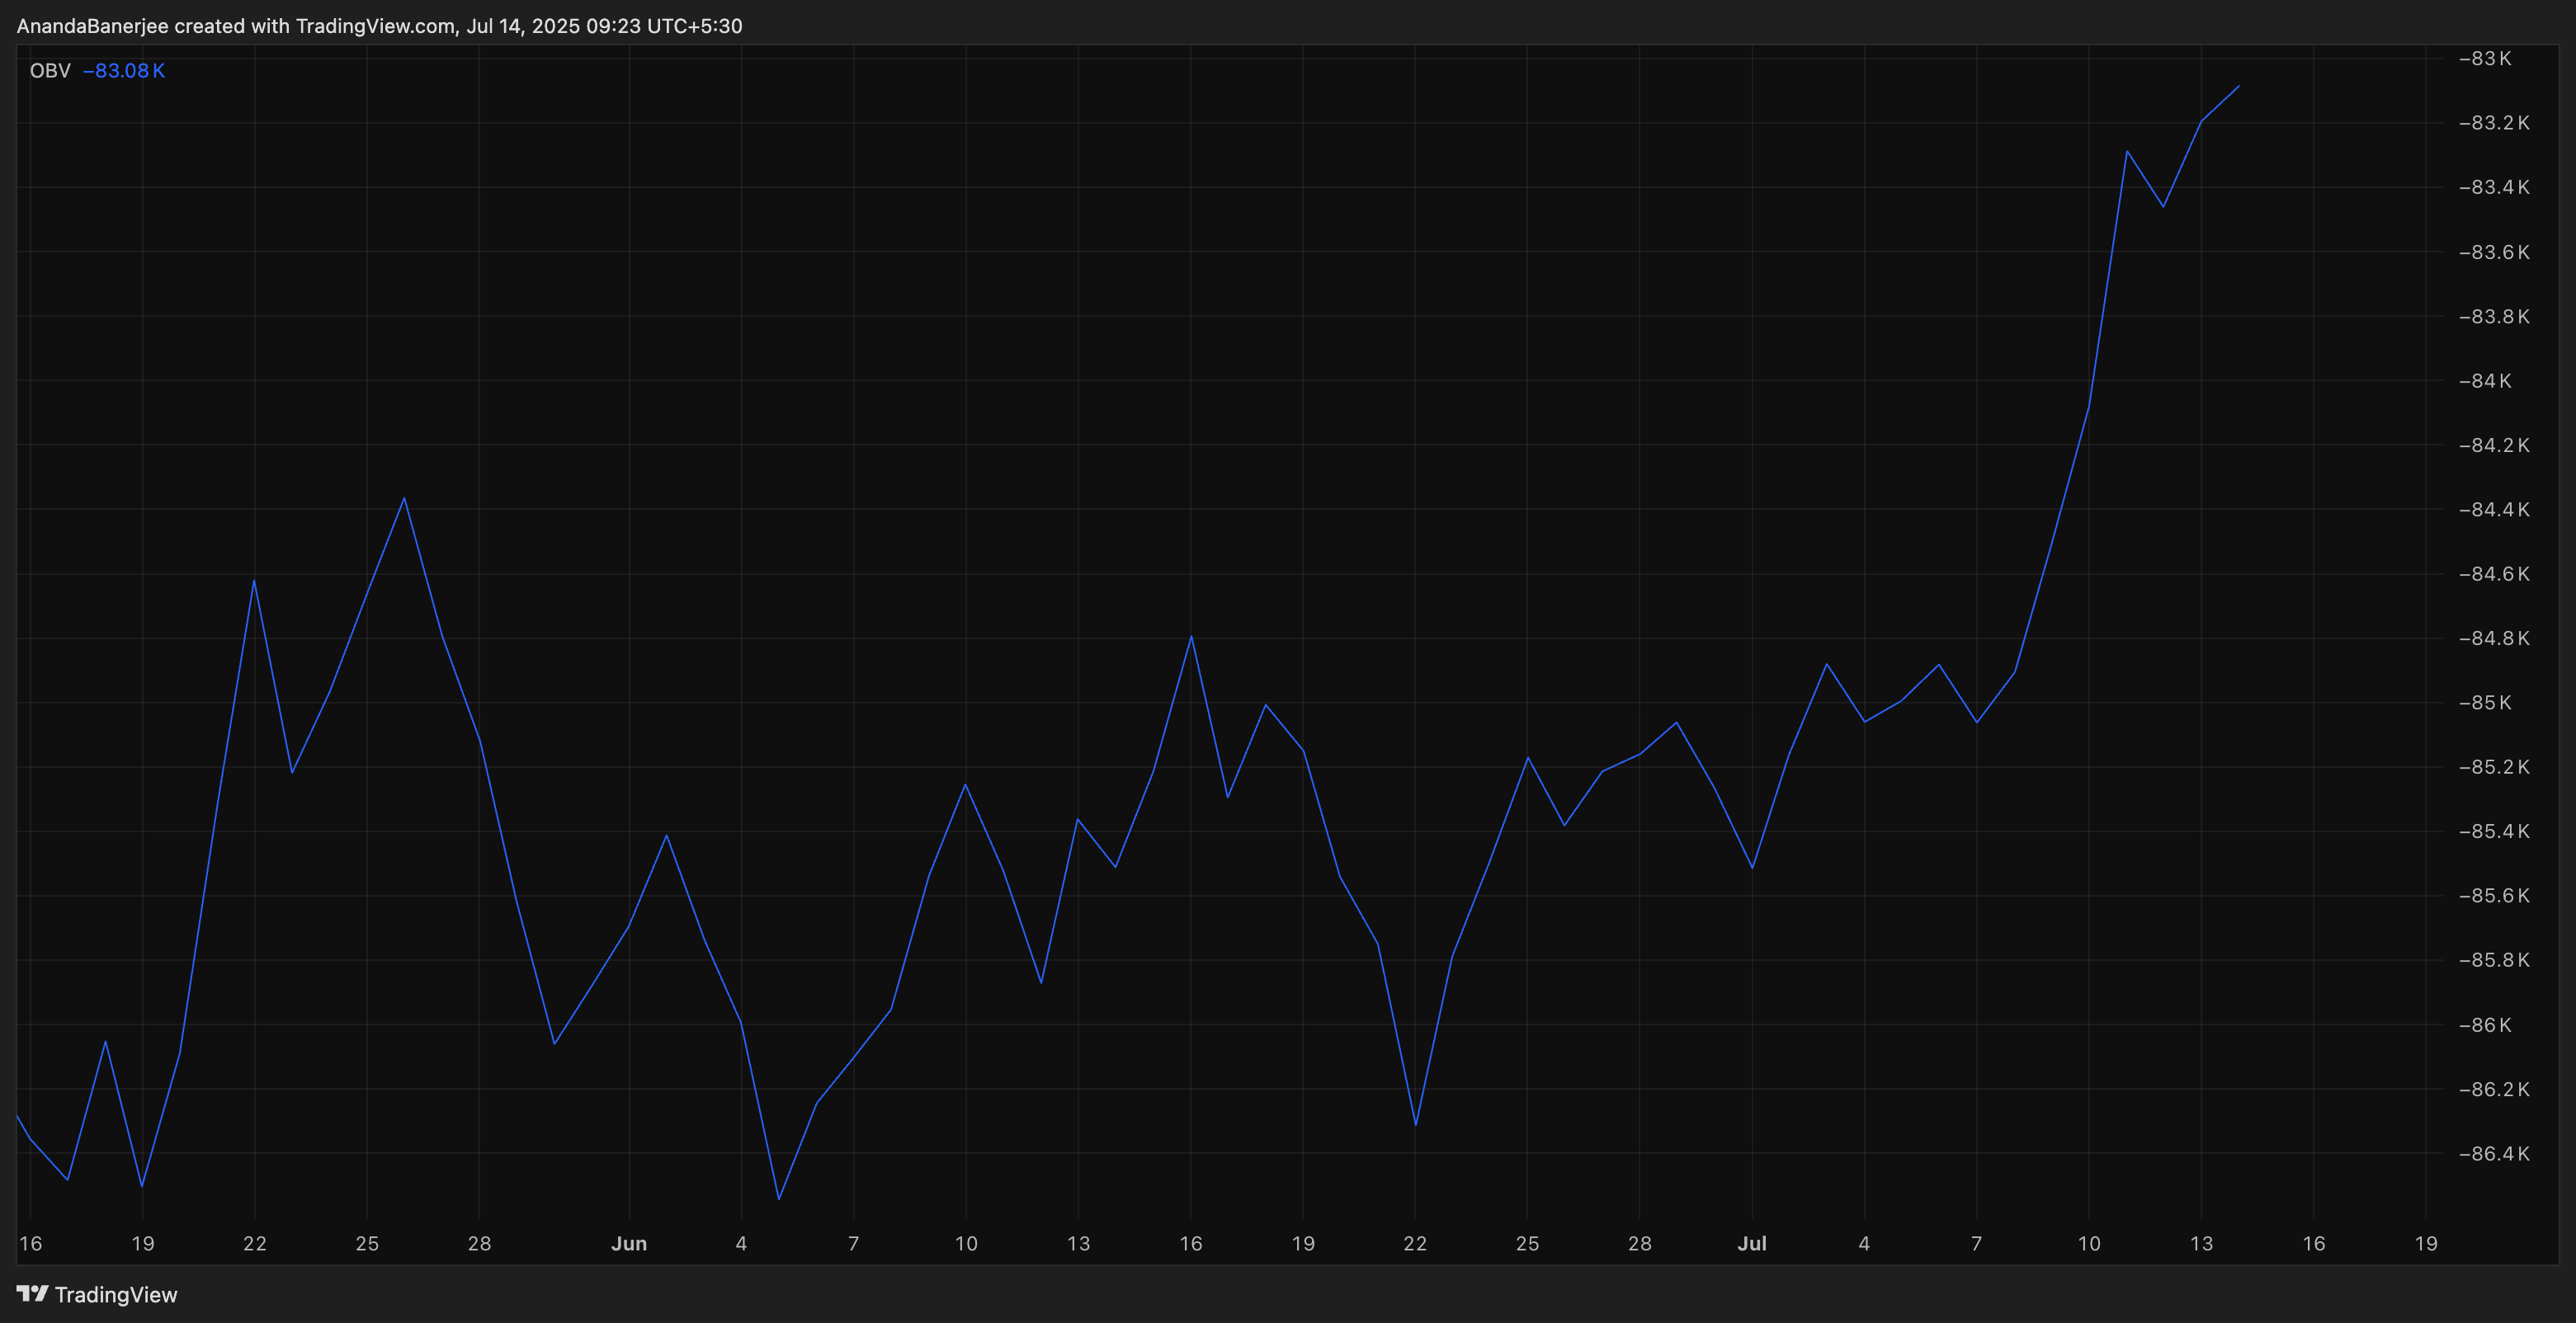 Bitcoin price supported by volume (OBV chart):
TradingView
In simpler terms: BTC is going up, and the volume is going with it, not against it.
OBV measures cumulative buy/sell pressure based on daily volume direction. It is a bullish sign when it follows a positive price trend.
BTC Price Structure and Next Levels
BTC is currently holding just below $121,519, a key resistance level from the Trend-Based Fibonacci Extension. If Bitcoin closes above this level, the next extension target is $127,798, followed by $135,425. These are long-range projections based on previous trend behavior.
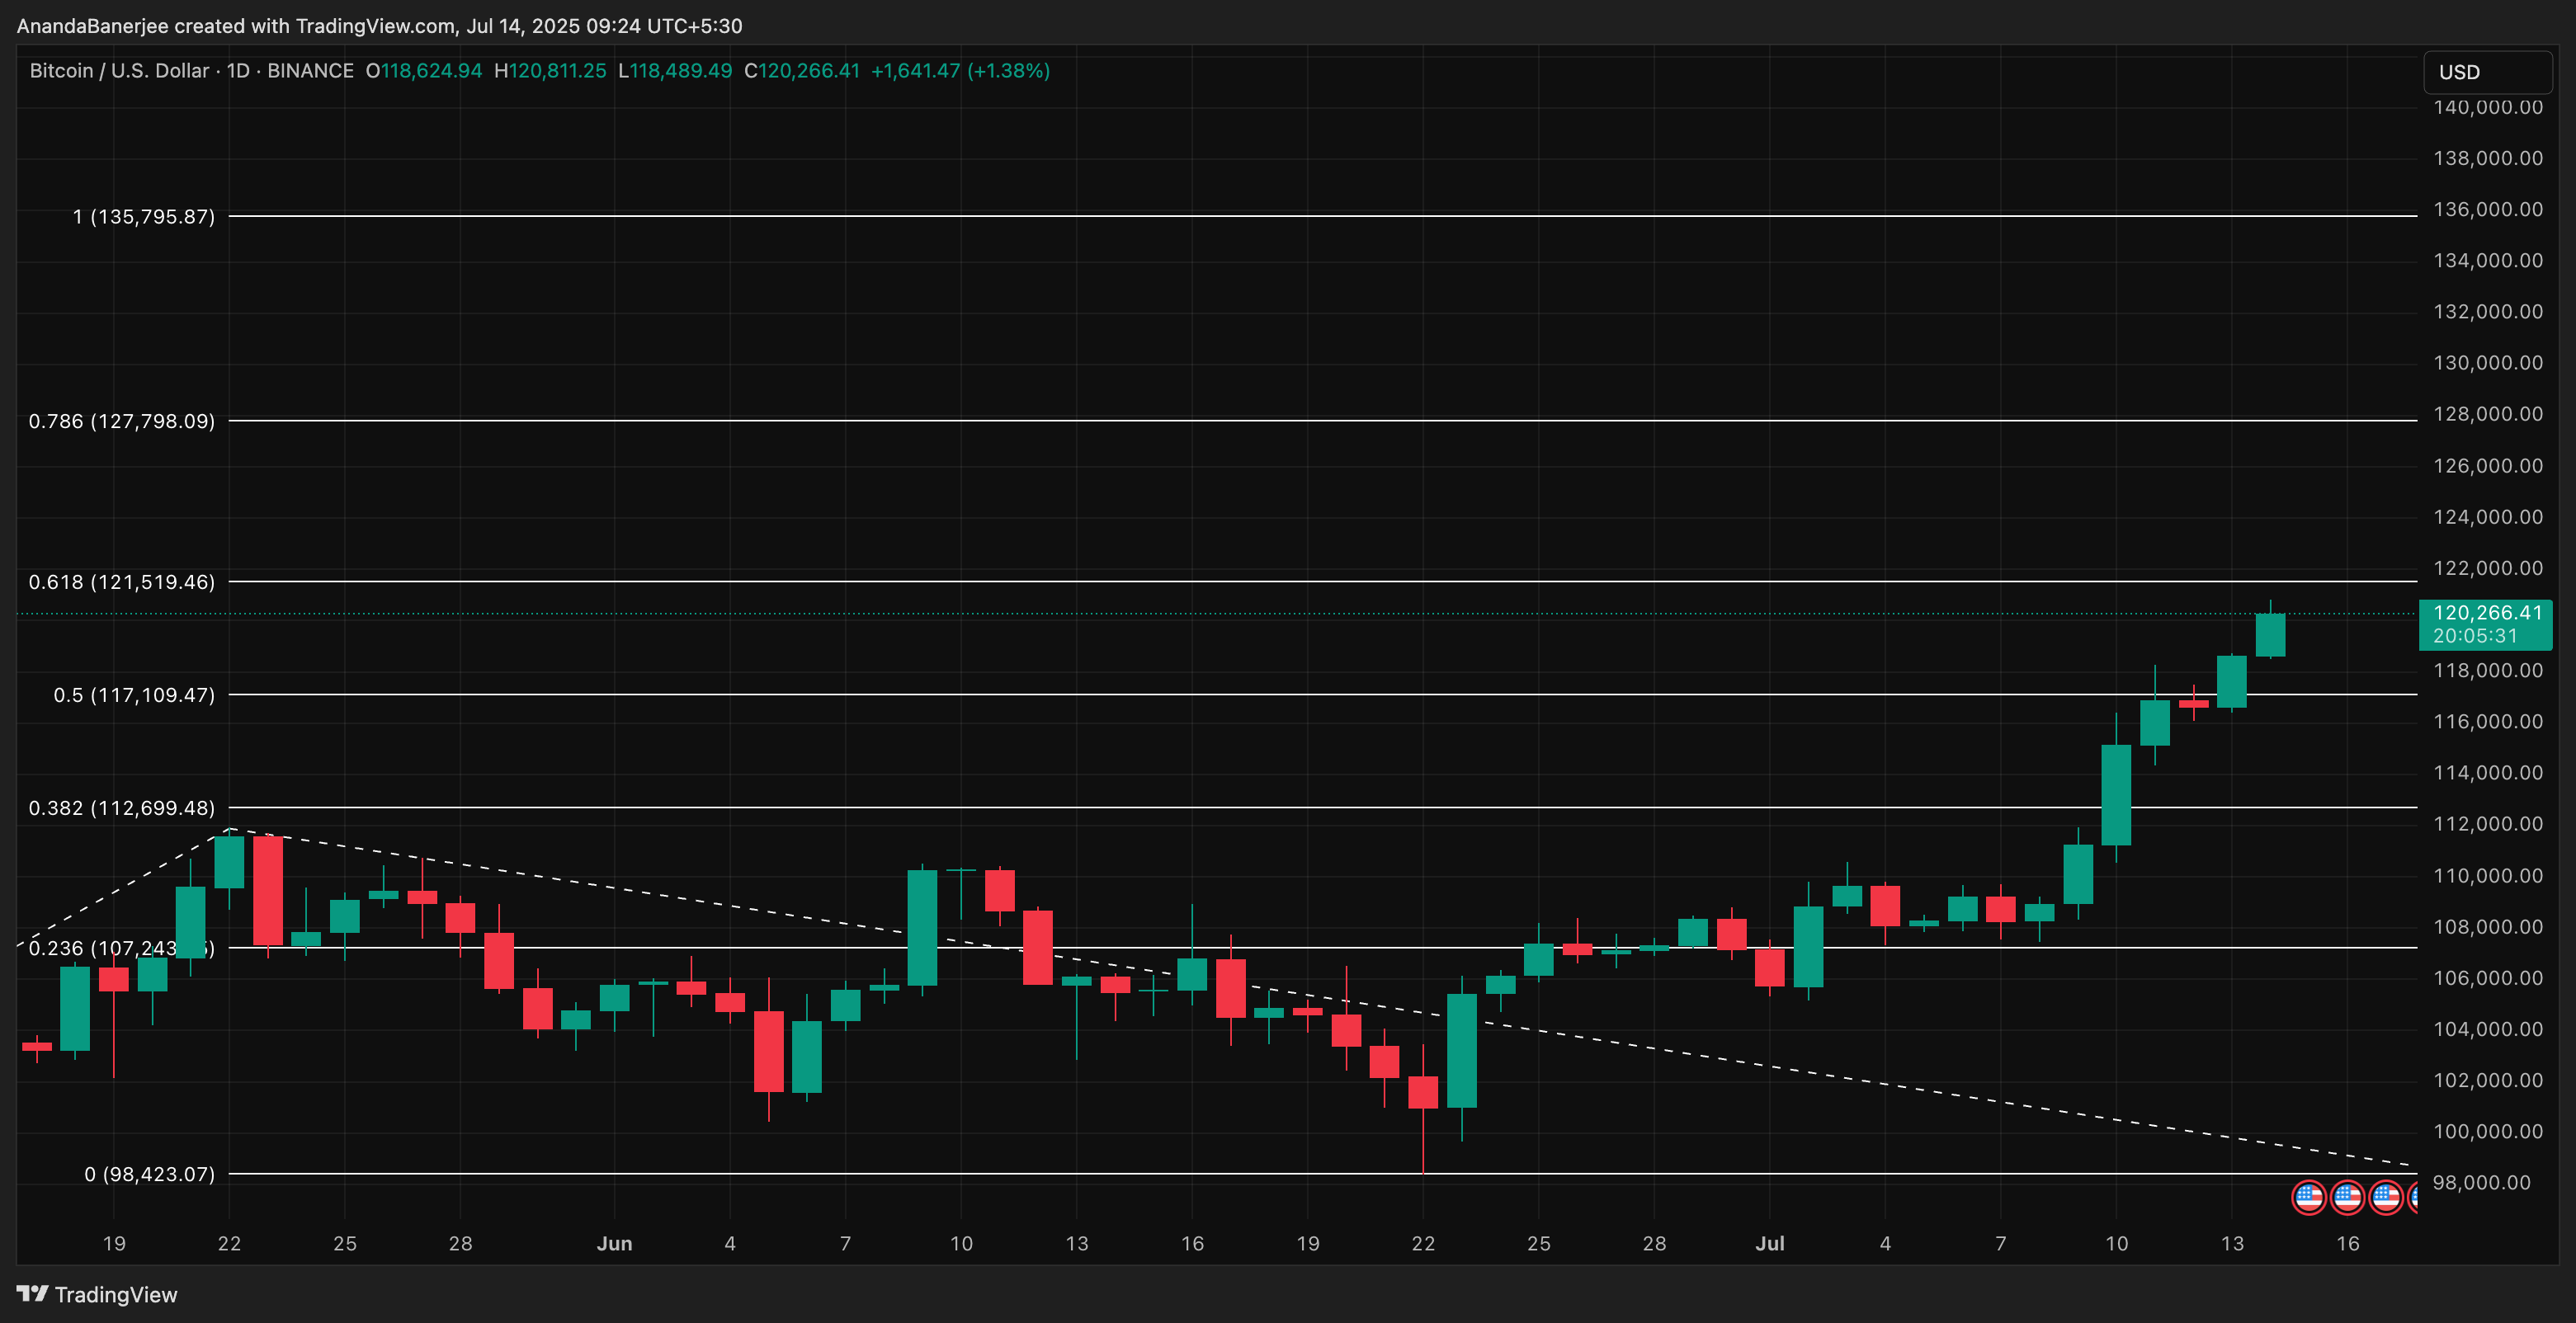 BTC price analysis:
TradingView
Trend-Based Fibonacci Extension is a tool that uses three key price points: a low, a high, and a retracement, to project future resistance levels in a trending market.
If BTC consolidates, near-term support sits at; $117,109, which is a prior breakout area. The bullish trend would weaken if BTC falls below $112,699, a key support level near the first all-time high, especially if exchange inflows spike or SOPR starts to rise sharply. That would suggest holders are starting to take profits aggressively, which could lead to a pullback or trend reversal.
Disclaimer: The content of this article solely reflects the author's opinion and does not represent the platform in any capacity. This article is not intended to serve as a reference for making investment decisions.
You may also like

Wall Street giants collectively raise rate hike forecasts, US Treasury futures continue to fall, gold drops over 1% to break 4000
After the US October CPI exceeded expectations, Goldman Sachs and Nomura added a forecast for an interest rate hike in March next year, while Deutsche Bank included a forecast for a rate hike in January next year. Currently, the market has fully priced in a 25 basis point rate hike in December, with a 13% probability for a 50 basis point hike. On Wednesday, the US Treasury spot market was closed, but Treasury futures continued to fall, with corresponding yields rising by about 2 to 4 basis points, and spot gold came under pressure, dropping by 1.1%.

No Need to Worry About the Cooling Down of AI Data Center Construction? The US Import Boom Is Unlikely to Subside in the Short Term, Real Impact May Come in 2029
It takes an average of 4.8 years from finalizing investment to starting construction of a data center project, and an additional 2.6 years from construction start to becoming operational. Servers usually cannot be installed until after the building structure and racks are completed. For trade partners such as Taiwan (China), South Korea, and Mexico who rely on US data center supply chain demand, the inertia in construction timelines provides at least a one- to two-year buffer for future exports.

Federal Reserve Major Debate: When Should the Tenure of “Number Three” Williams End?
The main point of contention is whether Williams should step down in June 2028, upon completing a full 10-year term, or in June 2027, when he reaches the mandatory retirement age of 65. Analysts point out that the Federal Reserve Board holds ultimate discretion; if he leaves early, Fed Chair Waller would be able to assert greater control over the appointment to this critical position. However, forcing Williams to shorten his term could easily be interpreted as political manipulation. Williams himself is expected to serve until June 2028.

Crypto prices
More


