
Ethereum Crashes 10% as Israel-Iran Conflict Sparks Market Turmoil

Ethereum’s price has dropped sharply amid rising geopolitical tensions between Israel and Iran. Market indicators suggest continued bearish sentiment, with traders betting on further losses.
Today, Ethereum has suffered a double-digit price decline as escalating geopolitical tensions between Israel and Iran rattle investor confidence across global markets.
On-chain data reveals that ETH’s sharp decline has sparked a surge in short positions across its futures market, signaling that many traders are now betting on further price losses.
ETH Crashes Amid Middle East Turmoil
The airstrike launched by Israel on Friday has intensified fears of broader conflict in the Middle East, sending shockwaves through both traditional and digital asset markets.
ETH, the second-largest cryptocurrency by market cap, has been hit hard, plunging over 10% in the past 24 hours as traders respond to growing geopolitical uncertainty.
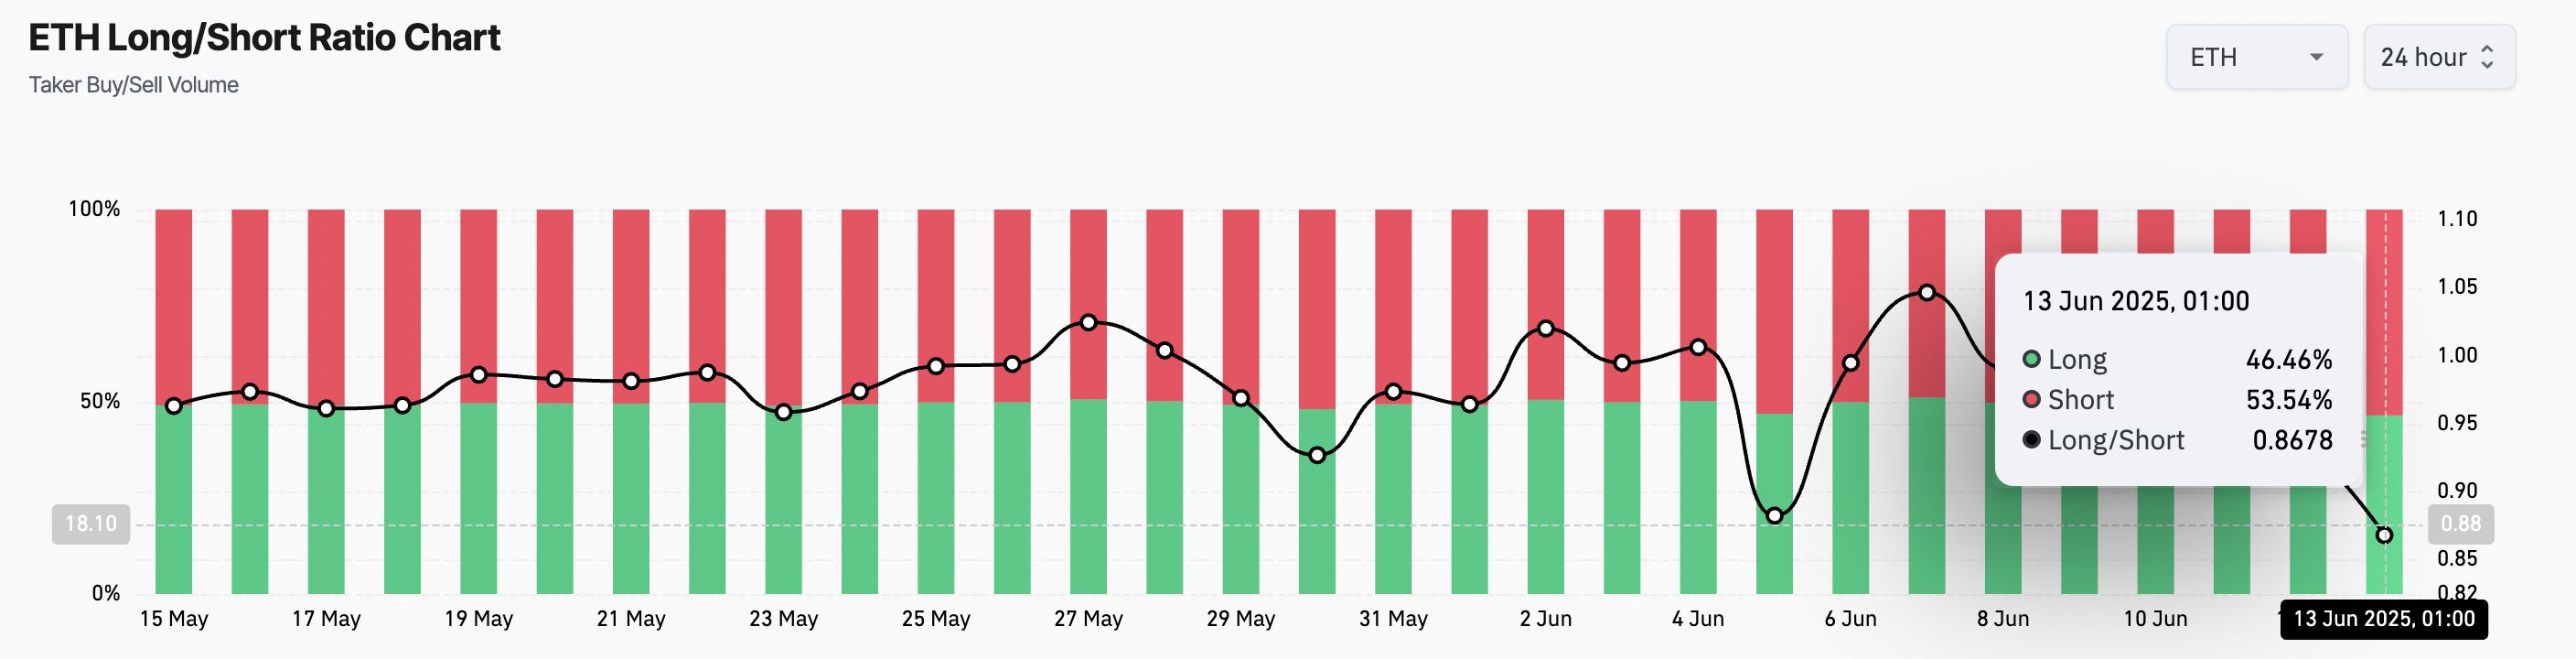
On-chain data suggests that many traders expect this price dip to continue, as reflected by the coin’s long/short ratio readings. At press time, this stands at 0.86, indicating more traders are betting against the altcoin.
 ETH Long/Short Ratio. Source:
Coinglass
This ratio compares the number of long and short positions in a market. When an asset’s long/short ratio is above 1, there are more long than short positions, indicating that traders are predominantly betting on a price increase.
Conversely, as seen with ETH, a ratio below one indicates that most traders are positioning for a price drop. This shows the heightening bearish sentiment and growing expectations of a continued decline.
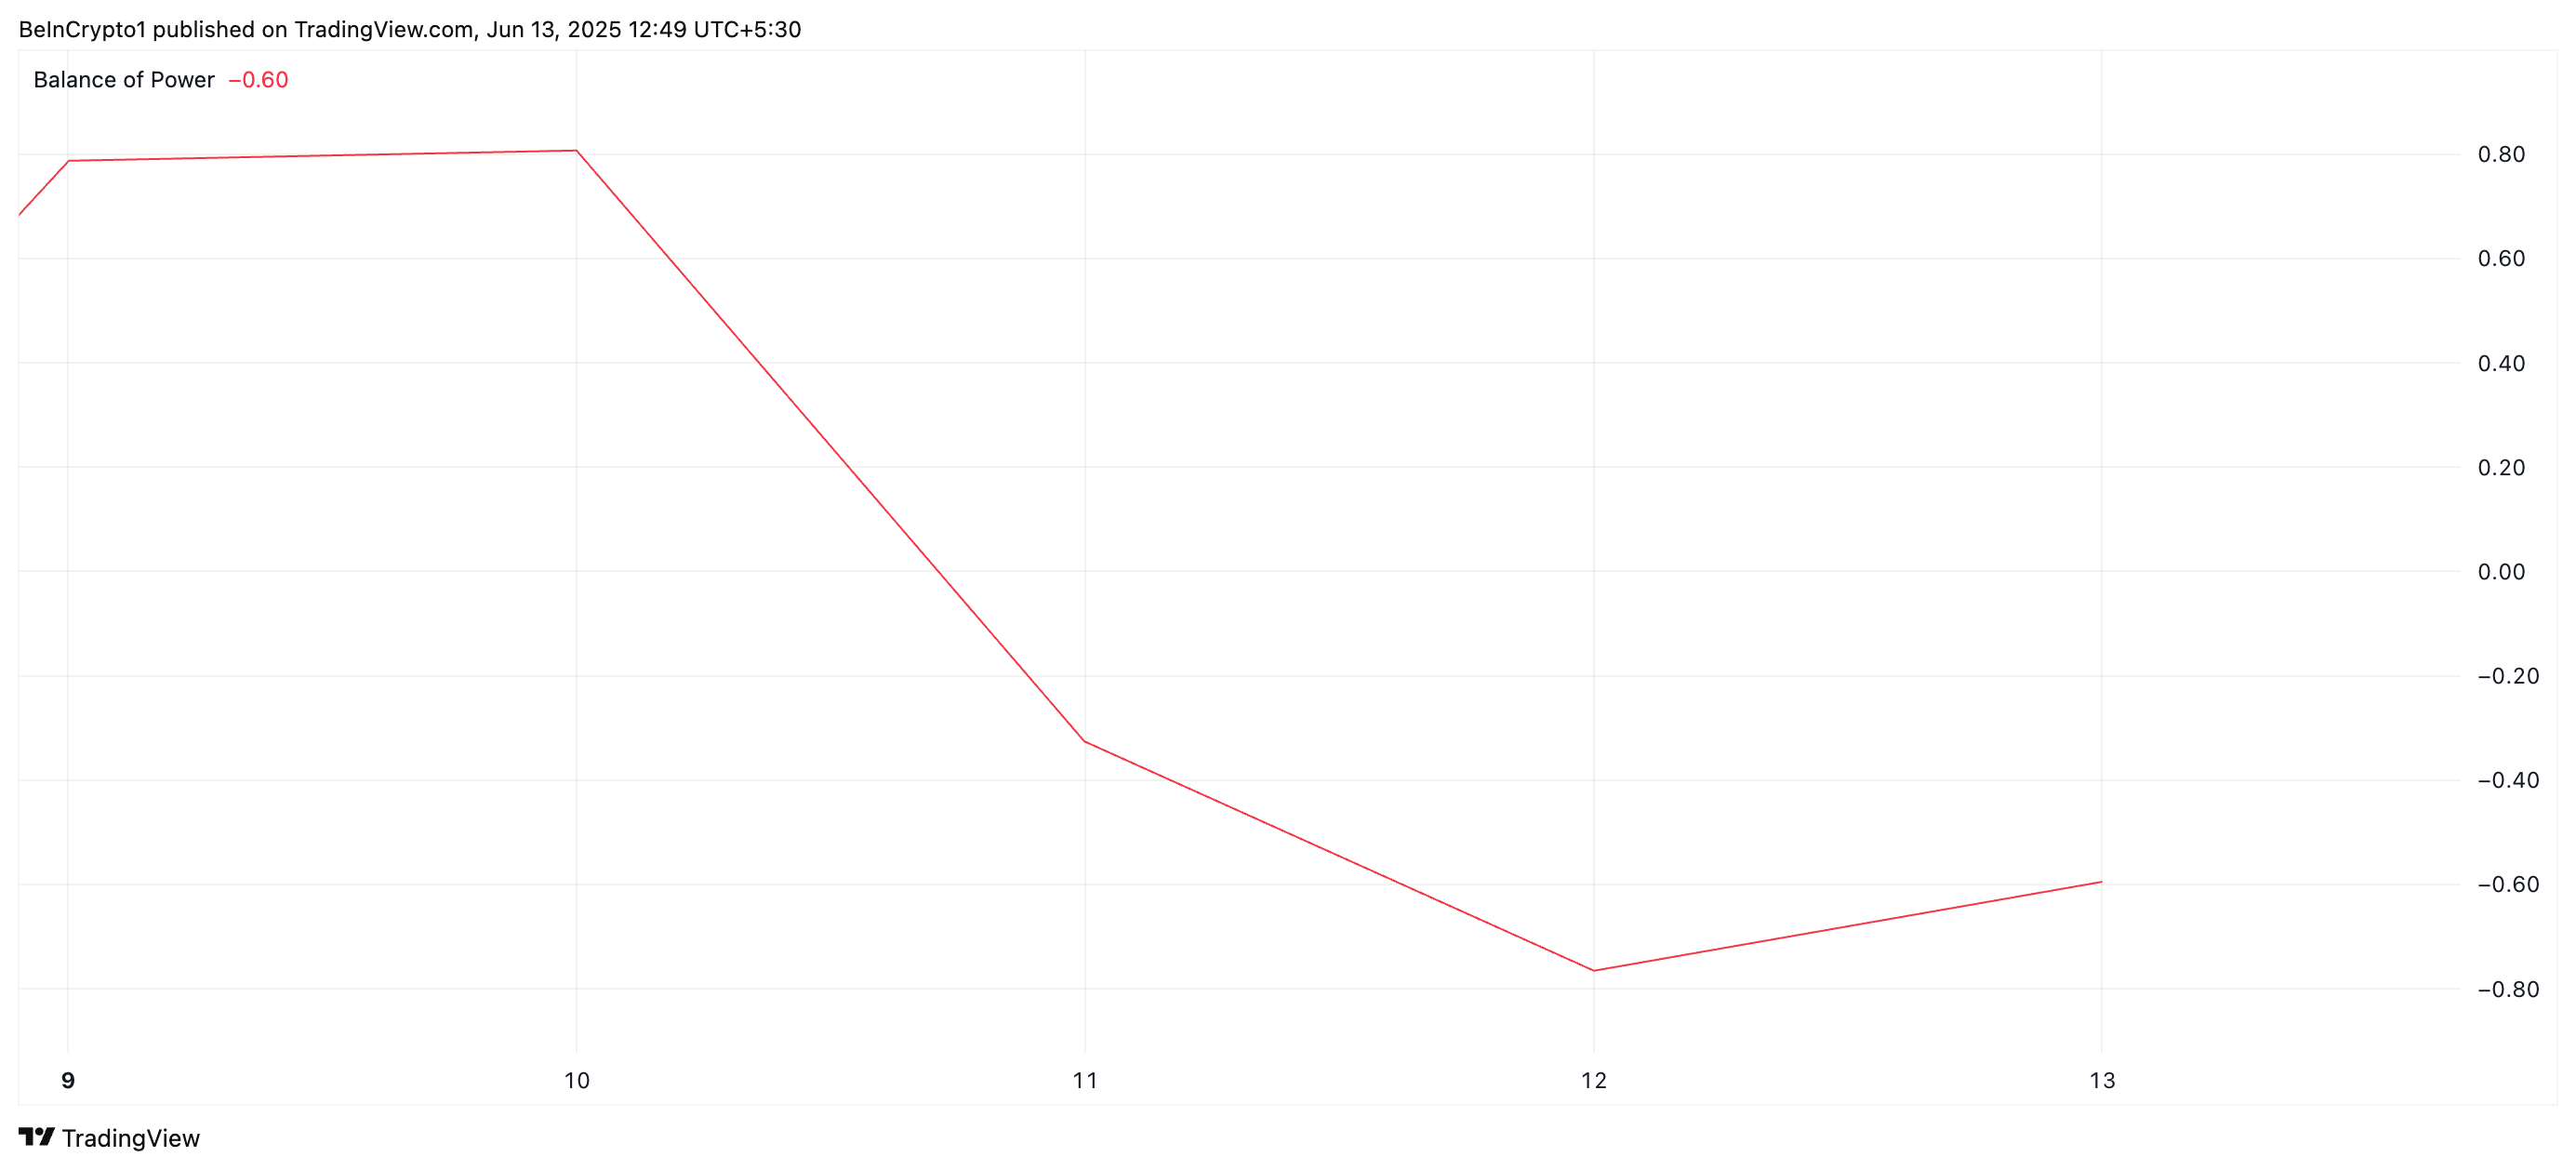
Furthermore, ETH’s negative Balance of Power (BoP) supports this bearish outlook. At press time, this momentum indicator is at -0.69, confirming the waning demand for the leading altcoin among market participants.
 ETH BoP. Source:
TradingView
The BoP indicator measures the strength of buyers versus sellers in the market. A negative BoP reading suggests that selling pressure dominates, indicating a lack of fresh demand and a higher likelihood of continued price decline.
Market Awaits ETH’s Next Move
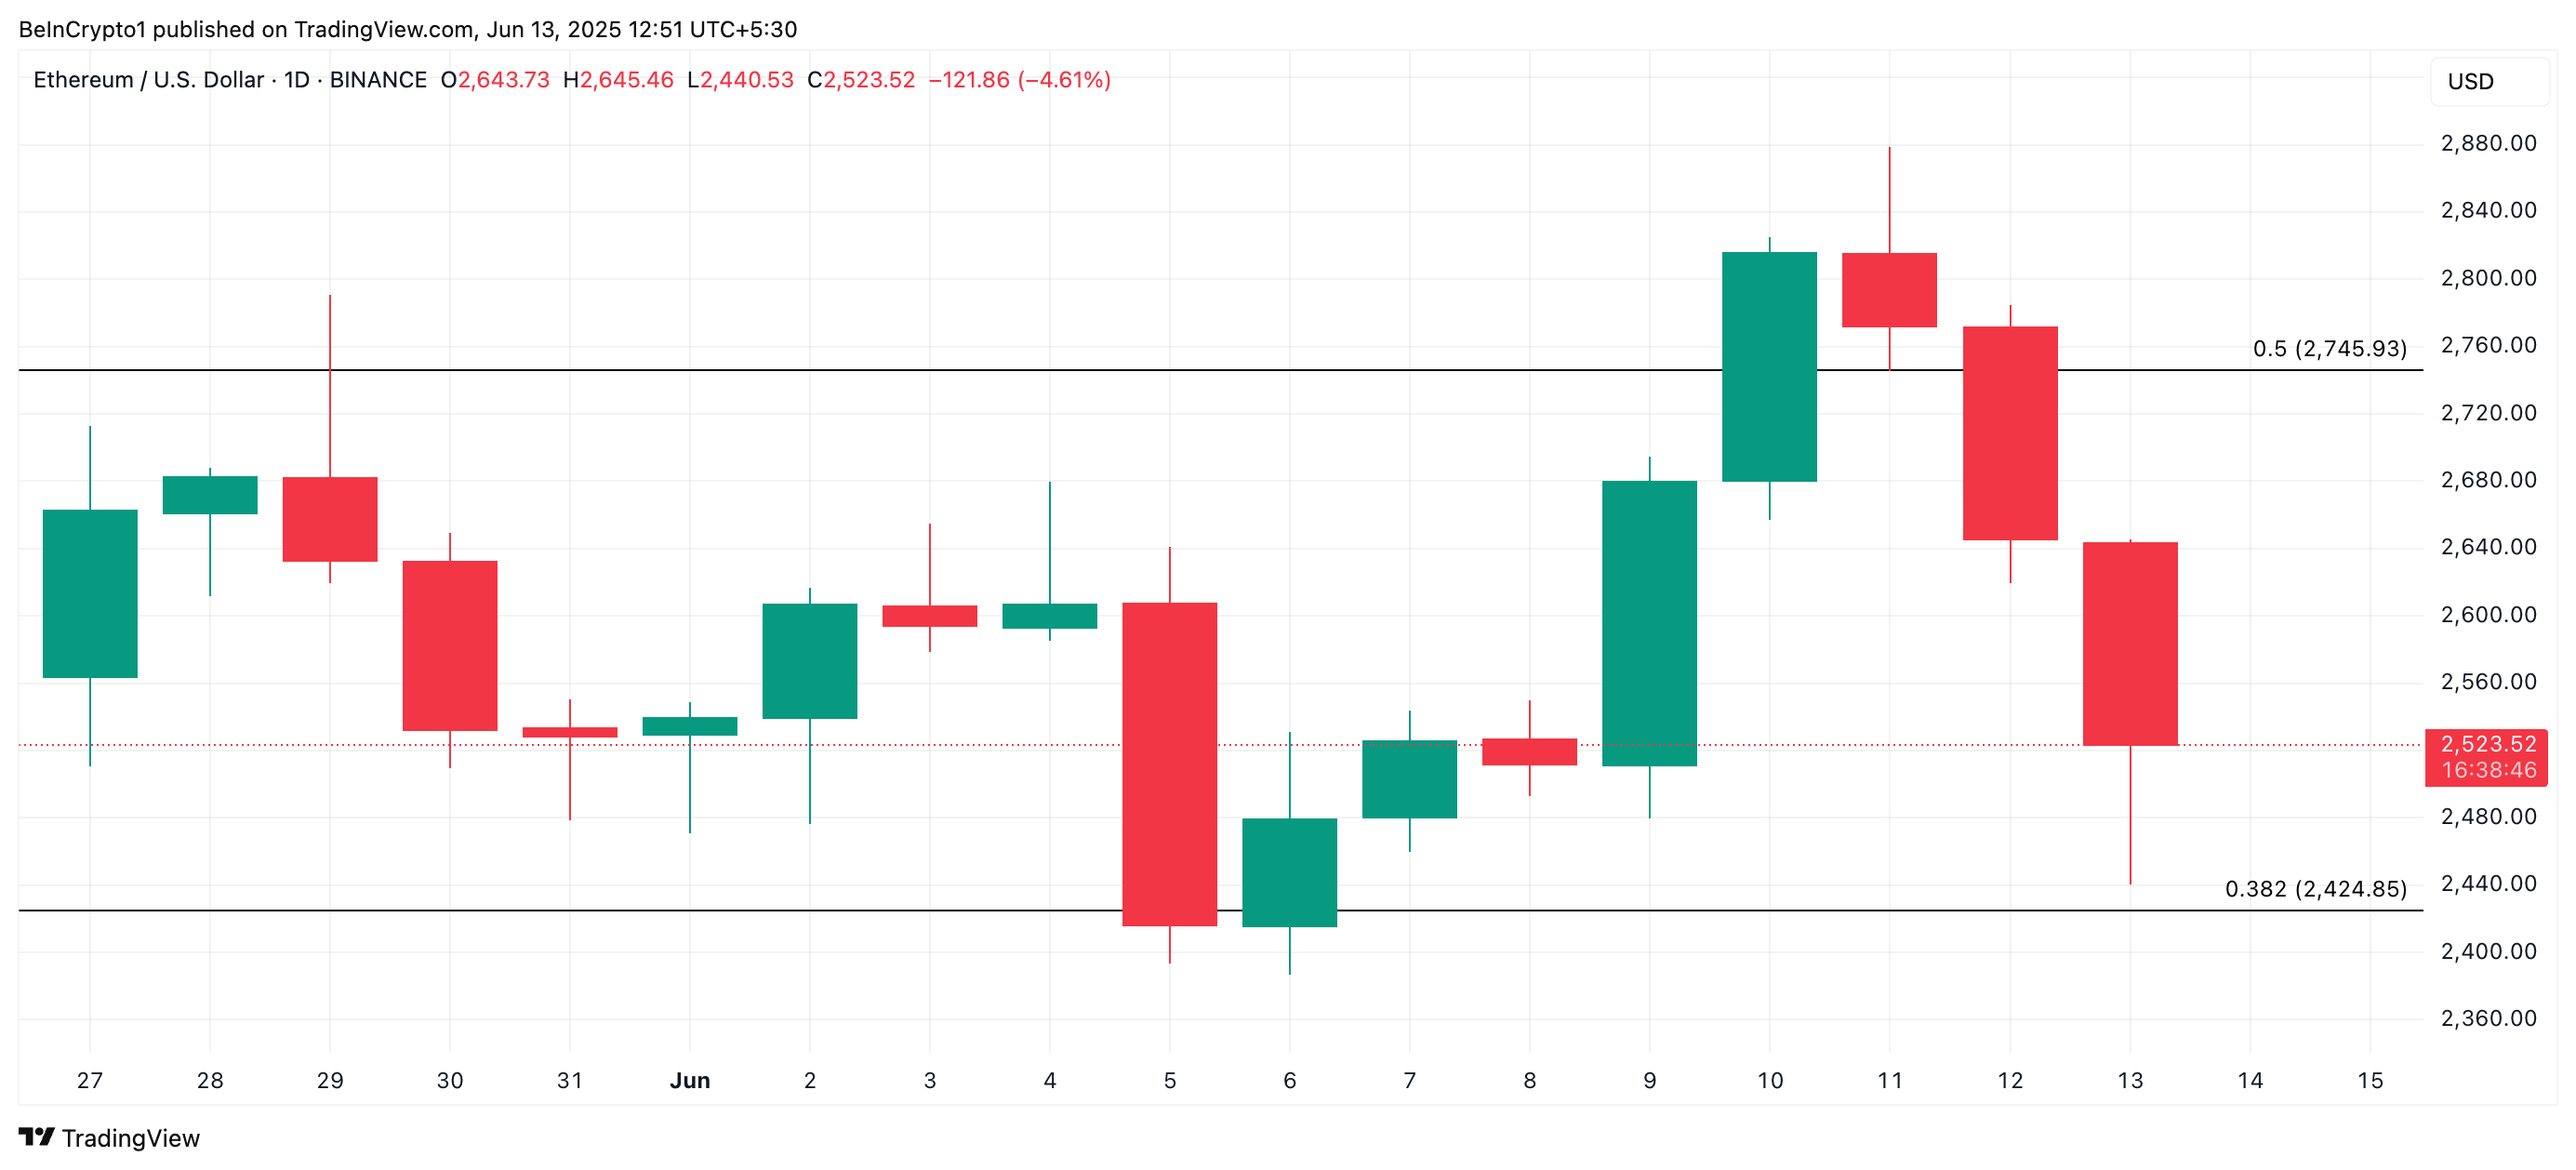
At press time, ETH trades at $2,523, holding just above the support floor at $2,424. If sell-side pressure strengthens, the coin could break below this floor, potentially triggering a further drop toward $2,027.
 ETH Price Analysis. Source:
TradingView
Conversely, a renewed wave of buying interest could invalidate the bearish outlook. In that case, ETH might rebound and rally toward $2,745.
Disclaimer: The content of this article solely reflects the author's opinion and does not represent the platform in any capacity. This article is not intended to serve as a reference for making investment decisions.
You may also like
After a week of "bloodbath" in US stocks, valuations now show investment value, but no one dares to say the bottom has arrived.
Last week, U.S. stocks experienced a massive sell-off, but in fact, there have been no fundamental changes in the underlying factors. Multiple valuation indicators now highlight their investment value, and the willingness of contrarian funds to buy the dip should be strong.

The script at the end of 2018: The Federal Reserve continued to raise interest rates, US stocks plunged 20% from the September highs, forcing the Federal Reserve to "pivot" in January.
Goldman Sachs' head of trading believes the current US stock market is repeating the scenario of late 2018, with monetary tightening and equity market pressure. The Goldman Sachs Financial Conditions Index has tightened by about 8 points in two weeks, reaching the highest level in a year. The selloff has broadened from tech stocks to defensive sectors. Gold and equities are declining simultaneously, possibly indicating investors are selling assets to raise cash, making gold a key indicator for observing liquidity stress.

Goldman Sachs Trader “Revisits the 2018 Playbook”: Still Clearly Remembers “On December 24th, Clients Asked Why the Market Dropped So Much—And I Had No Idea”
Brian Garrett pointed out that the current adjustment in the US stock market is similar to the sharp decline in Q4 2018: the S&P 500 has already experienced 42% of the corresponding drop, and the VIX is approaching its peak just before Christmas. If history repeats itself, the bottom of this cycle may appear in January next year. However, the credit market and Federal Reserve policy have yet to provide clear signals of a bottom.
Anthropic (ANT.US) nearly “broke issue price,” but Claude knocks on the doors of “the highest peak in mathematics”! 17 million lines of Lean code used to write a candidate proof for the Riemann Hypothesis
On November 20th, Eastern Time, on its second day of trading, Anthropic's intraday price dropped to a low of $83.05, just 5 cents above the offering price of $83, and finally closed at $88.91, a decline of 8.50%. On the same day, the company's mathematician Levant Alperg announced on his personal website that he and Claude had found a candidate proof for the Riemann hypothesis, which has puzzled the mathematics community for 167 years, and released about 17 million lines of Lean formalized code.

Crypto prices
More


