
If You Hold SHIB, Read This Before the Price Moves Again

Shiba Inu (SHIB) price has been on a volatile ride , reflecting the broader mood of the altcoin market. As of June 12, 2025, SHIB is trading at $0.00001274 on the hourly chart and $0.00001281 on the daily chart. Both charts point toward a critical phase where Shiba Inu must either defend key support or risk deeper corrections. Let's break down the technical analysis and predict where SHIB might head next.
Shiba Inu Price Prediction: Is SHIB Price Preparing for a Short-Term Reversal?
 SHIB/USD 1 Hr Chart- TradingView
On the hourly chart, SHIB price recently hit a low of $0.00001260 and rebounded slightly, forming a potential double-bottom pattern just above key support. The current price action is hovering around the 20-hour SMA, which is slightly below $0.00001285. A decisive close above this moving average would be the first sign of a short-term bullish reversal.
The Heikin Ashi candles show fading bearish momentum as the latest red candles are shrinking. This indicates that sellers are losing control. Moreover, the price has started testing the resistance at $0.00001285 again. If bulls manage to push SHIB above $0.00001291 (the 50-hour SMA), the next upside target would be the confluence zone between $0.00001309 and $0.00001331.
For this bounce to be validated, volume confirmation and a retest of $0.00001300 as support will be crucial. A 2% gain from here puts Shiba Inu price at $0.00001300, while a 5% surge pushes it to $0.00001338.
What Does the Daily Chart Reveal About the Trend?
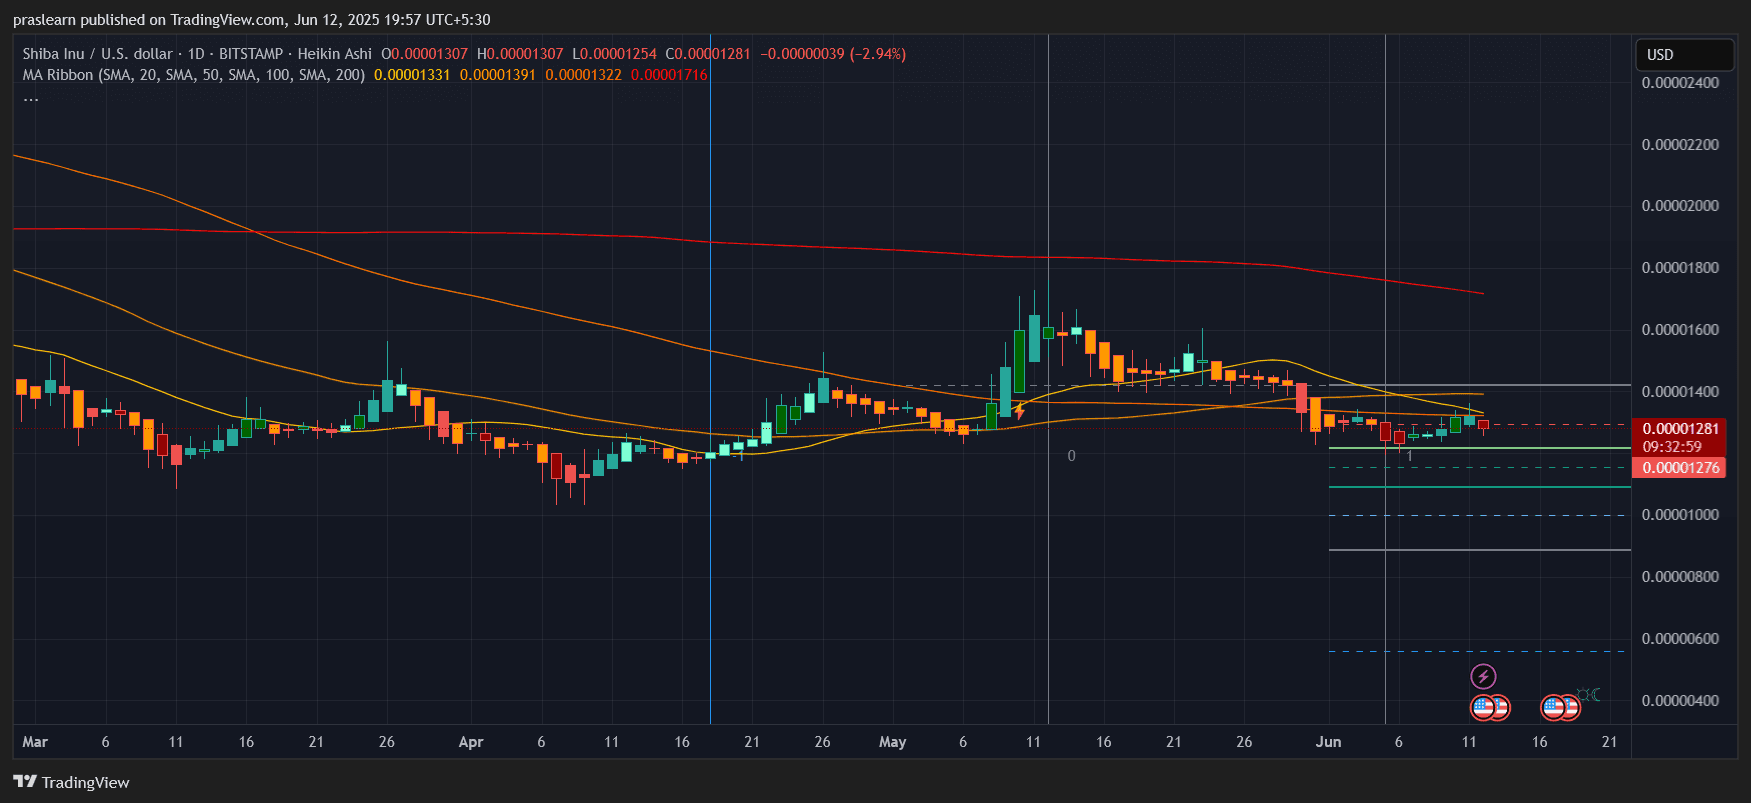 SHIB/USD Daily Chart- TradingView
Zooming out to the daily chart, the broader picture looks more bearish than bullish. SHIB price has been on a steady downtrend since May , failing to break past the 50-day SMA near $0.00001391. The current candle is showing rejection from the 20-day SMA, suggesting that the downtrend is still active unless a strong breakout occurs.
The support level of $0.00001276 has held well over the past week, acting as a base. If this support cracks, Shiba Inu price could decline toward the next major horizontal support near $0.00001150, which would imply a further 10% drop.
However, a rebound from here could form a higher low structure. If SHIB price reclaims the $0.00001330 level (just above the 100-day SMA) , the sentiment may flip bullish again. That would pave the way toward $0.00001400 and potentially even $0.00001700, where the 200-day SMA currently lies.
How Much Can SHIB Price Move from Here?
Let’s do some quick upside and downside calculations based on chart levels:
Upside potential from current price ($0.00001281) to resistance at $0.00001391 =
($0.00001391 - $0.00001281) ÷ $0.00001281 × 100 = 8.58% gain
Downside risk to support at $0.00001150 =
($0.00001281 - $0.00001150) ÷ $0.00001281 × 100 = 10.23% loss
This makes the current risk-reward ratio slightly unfavorable unless Shiba Inu price breaks $0.00001330 convincingly. If it does, the reward could increase significantly, changing the outlook.
Shiba Inu Price Prediction: Can SHIB Price Regain Its Momentum?
Technically, SHIB price is at a make-or-break level . The price structure is consolidating just above long-term support, while moving averages are starting to flatten. This often precedes a trend reversal or a strong breakdown.
If SHIB gains momentum and reclaims the 50-day SMA, buyers may regain confidence. On the other hand, sustained trading below $0.00001260 could accelerate the sell-off.
Final Thoughts: What’s Next for Shiba Inu Price?
Shiba Inu price is currently stuck between a weakening bearish grip and a potential bullish breakout zone. The key level to watch is $0.00001330 on the daily chart and $0.00001291 on the hourly chart. If these are cleared, SHIB price could rally by 8–10% in the near term.
However, if the support at $0.00001260 fails, we might see a swift move down to $0.00001150. Investors should keep an eye on volume and trendline rejections for confirmation before entering any trades. Patience is key, and SHIB’s next big move could be right around the corner.
$SHIB, $ShibaInu
Shiba Inu (SHIB) price has been on a volatile ride , reflecting the broader mood of the altcoin market. As of June 12, 2025, SHIB is trading at $0.00001274 on the hourly chart and $0.00001281 on the daily chart. Both charts point toward a critical phase where Shiba Inu must either defend key support or risk deeper corrections. Let's break down the technical analysis and predict where SHIB might head next.
Shiba Inu Price Prediction: Is SHIB Price Preparing for a Short-Term Reversal?
SHIB/USD 1 Hr Chart- TradingView
On the hourly chart, SHIB price recently hit a low of $0.00001260 and rebounded slightly, forming a potential double-bottom pattern just above key support. The current price action is hovering around the 20-hour SMA, which is slightly below $0.00001285. A decisive close above this moving average would be the first sign of a short-term bullish reversal.
The Heikin Ashi candles show fading bearish momentum as the latest red candles are shrinking. This indicates that sellers are losing control. Moreover, the price has started testing the resistance at $0.00001285 again. If bulls manage to push SHIB above $0.00001291 (the 50-hour SMA), the next upside target would be the confluence zone between $0.00001309 and $0.00001331.
For this bounce to be validated, volume confirmation and a retest of $0.00001300 as support will be crucial. A 2% gain from here puts Shiba Inu price at $0.00001300, while a 5% surge pushes it to $0.00001338.
What Does the Daily Chart Reveal About the Trend?
SHIB/USD Daily Chart- TradingView
Zooming out to the daily chart, the broader picture looks more bearish than bullish. SHIB price has been on a steady downtrend since May , failing to break past the 50-day SMA near $0.00001391. The current candle is showing rejection from the 20-day SMA, suggesting that the downtrend is still active unless a strong breakout occurs.
The support level of $0.00001276 has held well over the past week, acting as a base. If this support cracks, Shiba Inu price could decline toward the next major horizontal support near $0.00001150, which would imply a further 10% drop.
However, a rebound from here could form a higher low structure. If SHIB price reclaims the $0.00001330 level (just above the 100-day SMA) , the sentiment may flip bullish again. That would pave the way toward $0.00001400 and potentially even $0.00001700, where the 200-day SMA currently lies.
How Much Can SHIB Price Move from Here?
Let’s do some quick upside and downside calculations based on chart levels:
Upside potential from current price ($0.00001281) to resistance at $0.00001391 =
($0.00001391 - $0.00001281) ÷ $0.00001281 × 100 = 8.58% gain
Downside risk to support at $0.00001150 =
($0.00001281 - $0.00001150) ÷ $0.00001281 × 100 = 10.23% loss
This makes the current risk-reward ratio slightly unfavorable unless Shiba Inu price breaks $0.00001330 convincingly. If it does, the reward could increase significantly, changing the outlook.
Shiba Inu Price Prediction: Can SHIB Price Regain Its Momentum?
Technically, SHIB price is at a make-or-break level . The price structure is consolidating just above long-term support, while moving averages are starting to flatten. This often precedes a trend reversal or a strong breakdown.
If SHIB gains momentum and reclaims the 50-day SMA, buyers may regain confidence. On the other hand, sustained trading below $0.00001260 could accelerate the sell-off.
Final Thoughts: What’s Next for Shiba Inu Price?
Shiba Inu price is currently stuck between a weakening bearish grip and a potential bullish breakout zone. The key level to watch is $0.00001330 on the daily chart and $0.00001291 on the hourly chart. If these are cleared, SHIB price could rally by 8–10% in the near term.
However, if the support at $0.00001260 fails, we might see a swift move down to $0.00001150. Investors should keep an eye on volume and trendline rejections for confirmation before entering any trades. Patience is key, and SHIB’s next big move could be right around the corner.
$SHIB, $ShibaInu
Disclaimer: The content of this article solely reflects the author's opinion and does not represent the platform in any capacity. This article is not intended to serve as a reference for making investment decisions.
You may also like
What happened? AI trading crash! Nasdaq drops over 5%, Anthropic IPO nearly breaks on the second day, Nvidia falls over 10%
Investors are not doubting the prospects of AI technology, but are beginning to question whether current valuations have fully priced in future growth. Anthropic's popularity does not prove the investment logic for the entire industry. Since Jensen Huang resigned as CEO, NVIDIA has experienced seven consecutive declines, falling nearly 28% in seven days. After Huang was investigated, news of a SEC accounting investigation added further pressure, causing its market value to evaporate by $2.65 trillion compared to the October peak. AMD closed down more than 10%, plunging for two consecutive days after a short-selling report, and the entire AI industry chain is undergoing widespread sell-off. The return on AI capital expenditure is being questioned, and the unwinding of crowded trades is amplifying the downward trend.
AI Trading Crash! Gold, Silver, and Copper Plunge Across the Board; Full-cycle Gold Falls Over 9%, New York Copper Down Nearly 10%, Crude Oil Drops 20% in Three Weeks
Expectations for a Fed rate hike are rising, and the wave of AI sell-offs has triggered cross-asset deleveraging. Precious metals faced intensive selling: New York gold futures closed down nearly 5% on Friday, marking the largest weekly drop in eight months; silver futures fell more than 7% and dropped 17% for the week. AI demand expectations are being repriced, leading to seven consecutive days and six consecutive weeks of decline for New York copper, the longest weekly losing streak in over four years. Geopolitical risks supported a rebound in US crude oil on Friday, but concerns about oversupply continued to weigh on its overall weekly performance, with both US crude and Brent falling for three consecutive weeks.
The cybersecurity industry may witness the largest merger in history: CrowdStrike is in talks to acquire Zscaler, and the combined market value could reach $265 billion.
According to media reports, the two companies are discussing a potential merger, but it is still uncertain whether a deal will be reached. Details regarding the transaction price, payment method, and acquisition premium have not been disclosed. If the integration is successful, both parties are expected to unify their endpoint, identity, network, and cloud security capabilities into a more cohesive platform, expanding their reach to enterprise clients. Following the news, Zscaler surged 16% after hours, while CrowdStrike dropped 7.4% after hours.
One month before the IPOs of Anthropic and SpaceX, bitcoin fell 22%. How will liquidity dynamics drive the future market trend?
SBET's Chief Investment Officer attributes this phenomenon to a "liquidity event rapidly increasing correlations between assets"—investors sell crypto assets to participate in star IPOs. Following this logic, most brokerages require investors to wait 15 to 30 days after being allotted new shares before selling. After the SpaceX IPO, on the 31st day, ETH’s price surpassed its level on the IPO day, and by the 70th day, BTC's downward trend reversed.
Crypto prices
More


