
XRP Eyes Strong Rally as Long-Term Holders Shake Off Sell Pressure

XRP's price is rising as long-term holders show confidence, slowing token movements, and market data points to a bullish continuation, with a target of $2.50.
XRP has been on a steady climb over the past few days, fueled by a reduction in liquidation activity among its long-term holders (LTHs).
On-chain data reveals a marked slowdown in token movements among these investors, indicating that LTHs are holding firm rather than selling off their positions. This hints at a sustained price rally in the short term.
XRP Shows Signs of Accumulation as LTH Selloff Activity Declines
According to data from Glassnode, XRP’s liveliness has steadily declined since June 5, slipping by 1% to reach 0.809 as of June 8, signaling reduced activity among LTHs.
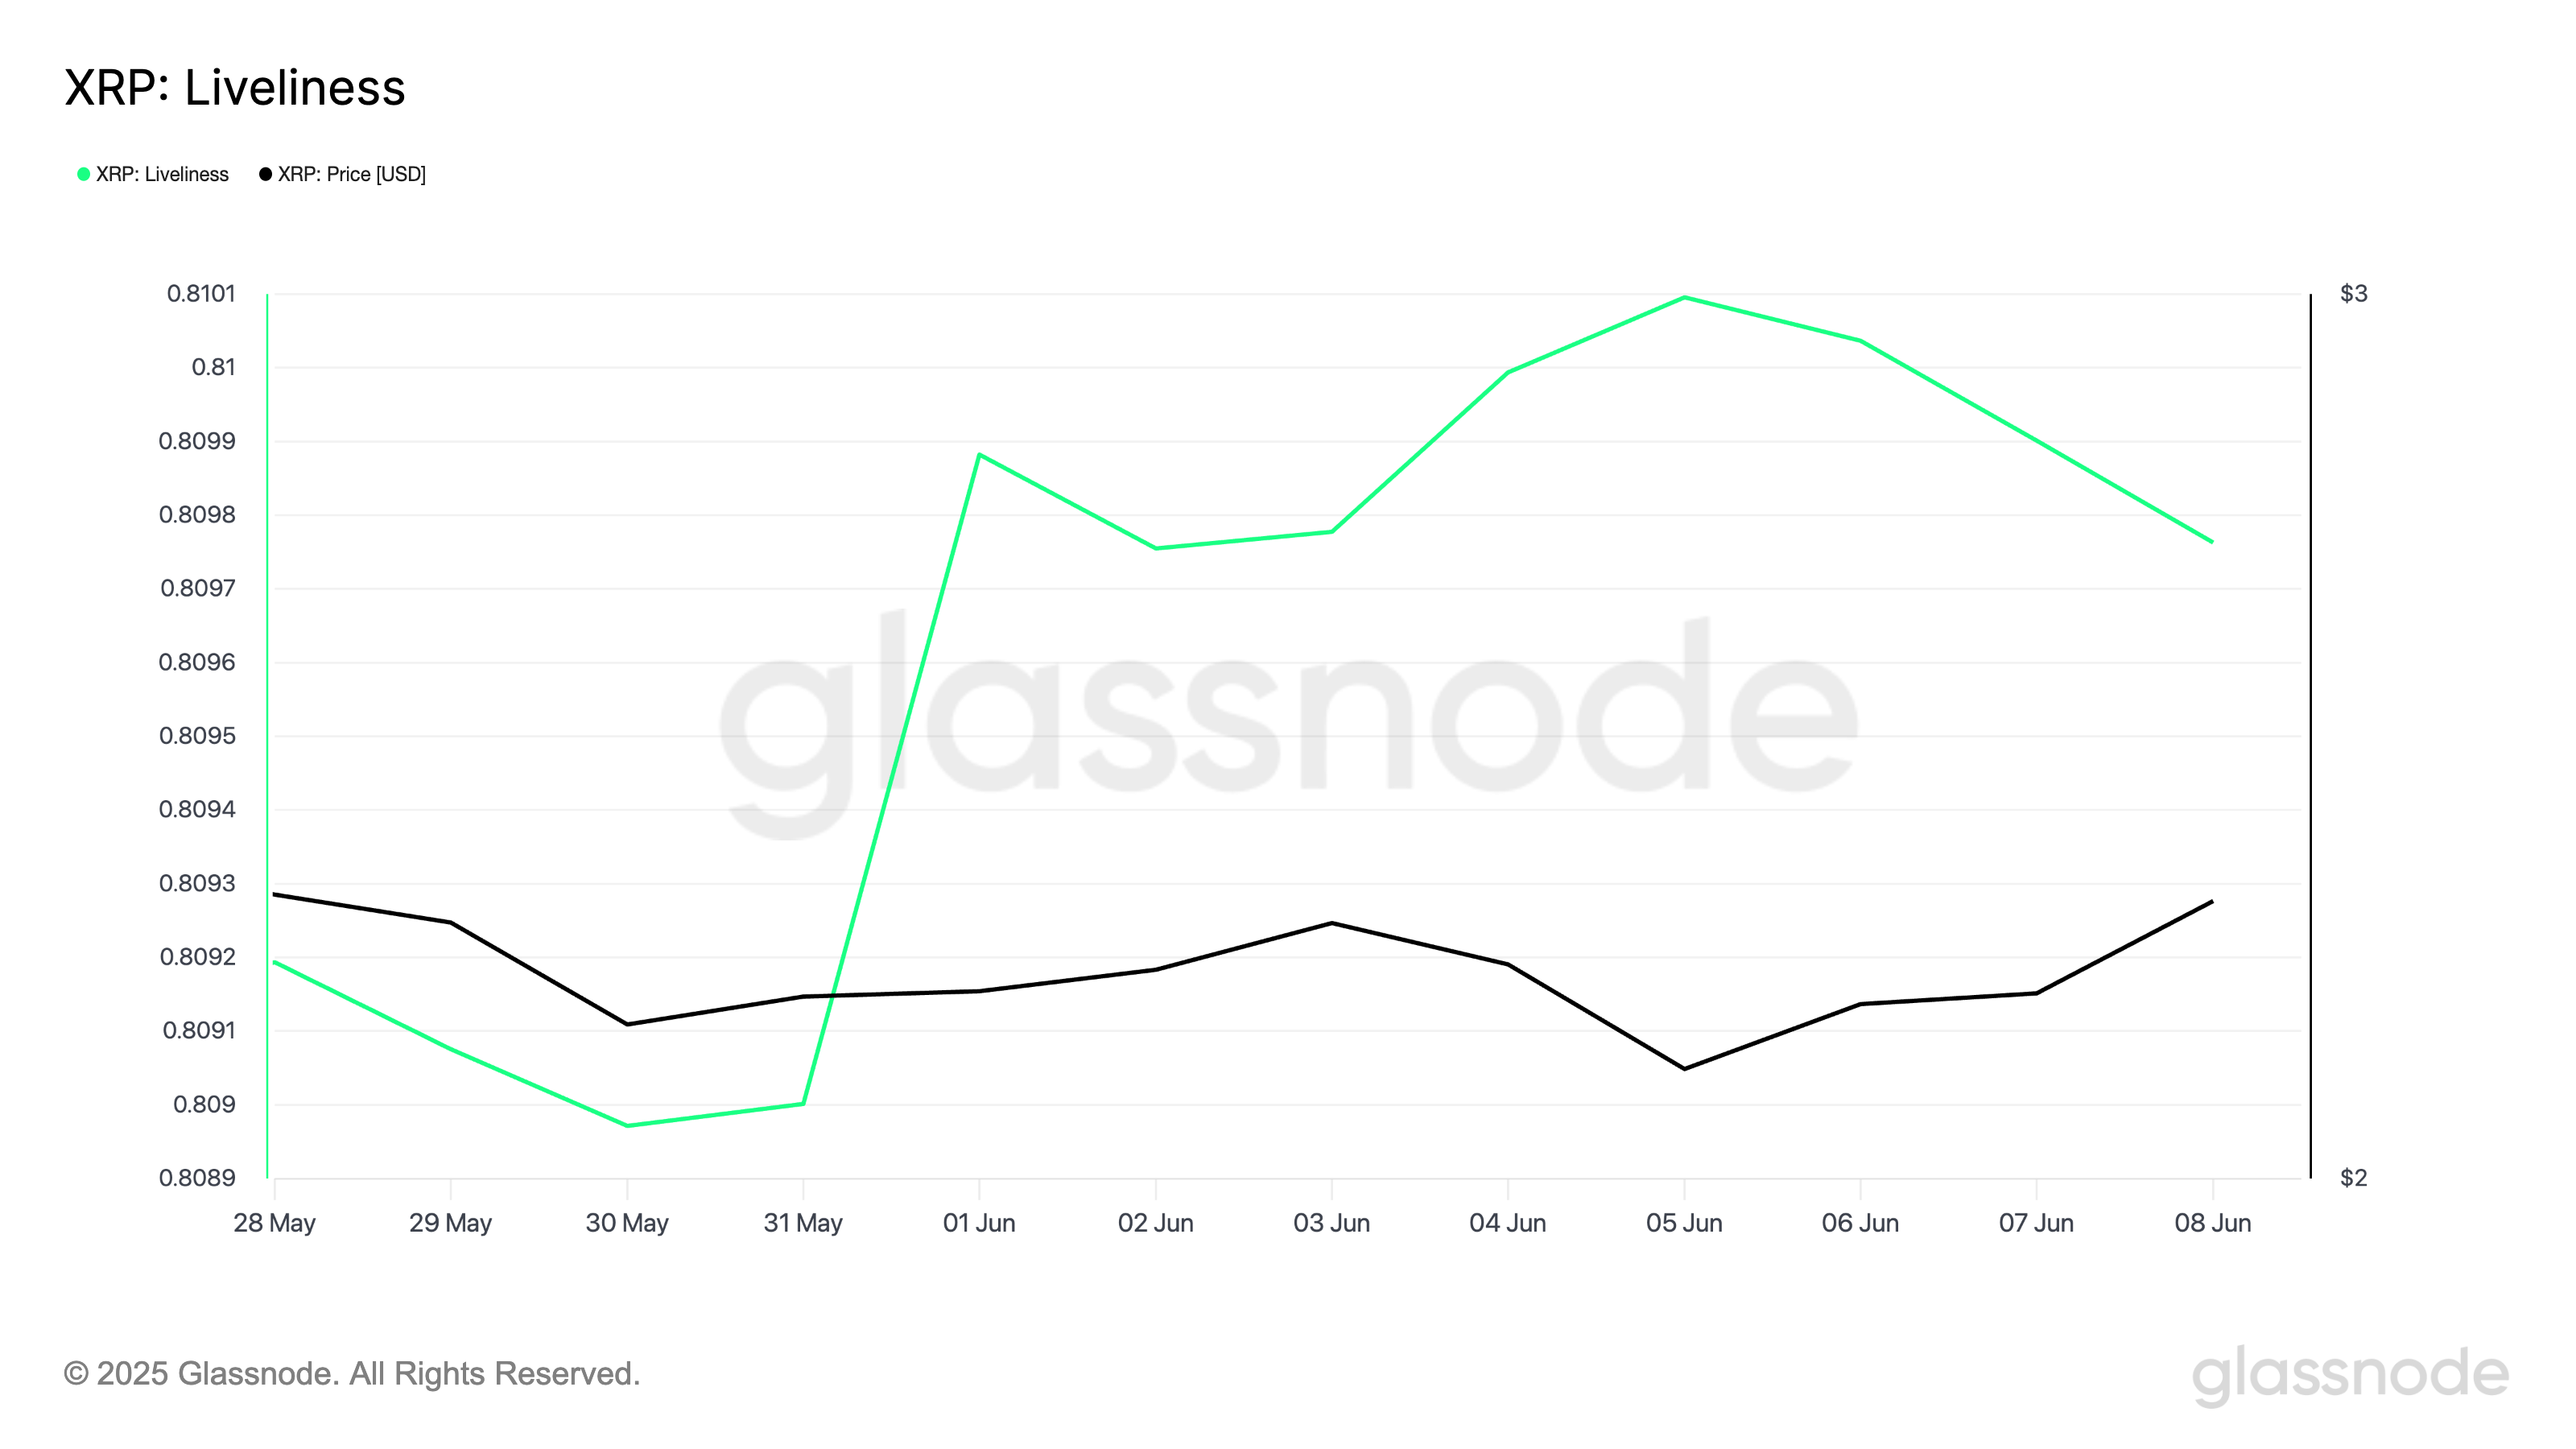 XRP Liveliness. Source:
Glassnode
Liveliness tracks the movement of long-held/dormant tokens. It does this by measuring the ratio of an asset’s coin days destroyed to the total coin days accumulated. When the metric climbs, it means that LTHs are moving their coins or selling them.
On the other hand, when it falls like this, LTHs are moving their assets off exchanges, a move typically seen as a bullish signal of accumulation.
Further, this positive shift in holder behavior is echoed in the XRP derivatives market, evidenced by its consistently positive funding rate since June 6. As of this writing, this is at 0.0080%, signaling that most traders are betting on continued upside.
 XRP Funding Rate. Source:
Coinglass
The funding rate is a periodic fee exchanged between traders in perpetual futures markets to keep contract prices aligned with the spot price.
When positive, it implies that long positions are dominant and that short sellers are willing to pay to keep their positions open, a strong indicator of bullish sentiment.
XRP Teeters Between Breakout and Pullback as Golden Cross Looms
Readings from the XRP/USD one-day chart confirm the potential bullish shift, as the token’s Moving Average Convergence Divergence (MACD) indicator hints at the formation of a golden cross. This occurs when the MACD line (blue) prepares to cross above the signal line ( orange), a setup widely regarded as a bullish momentum signal.
The MACD indicator identifies trends and momentum in an asset’s price movement. It helps traders spot potential buy or sell signals through crossovers between the MACD and signal lines. When the MACD line is above the signal line, it indicates bullish momentum, suggesting that the asset’s price may continue to rise.
A successful formation of the golden cross will confirm XRP’s rally and could push its price past the resistance at $2.29, toward $2.50.
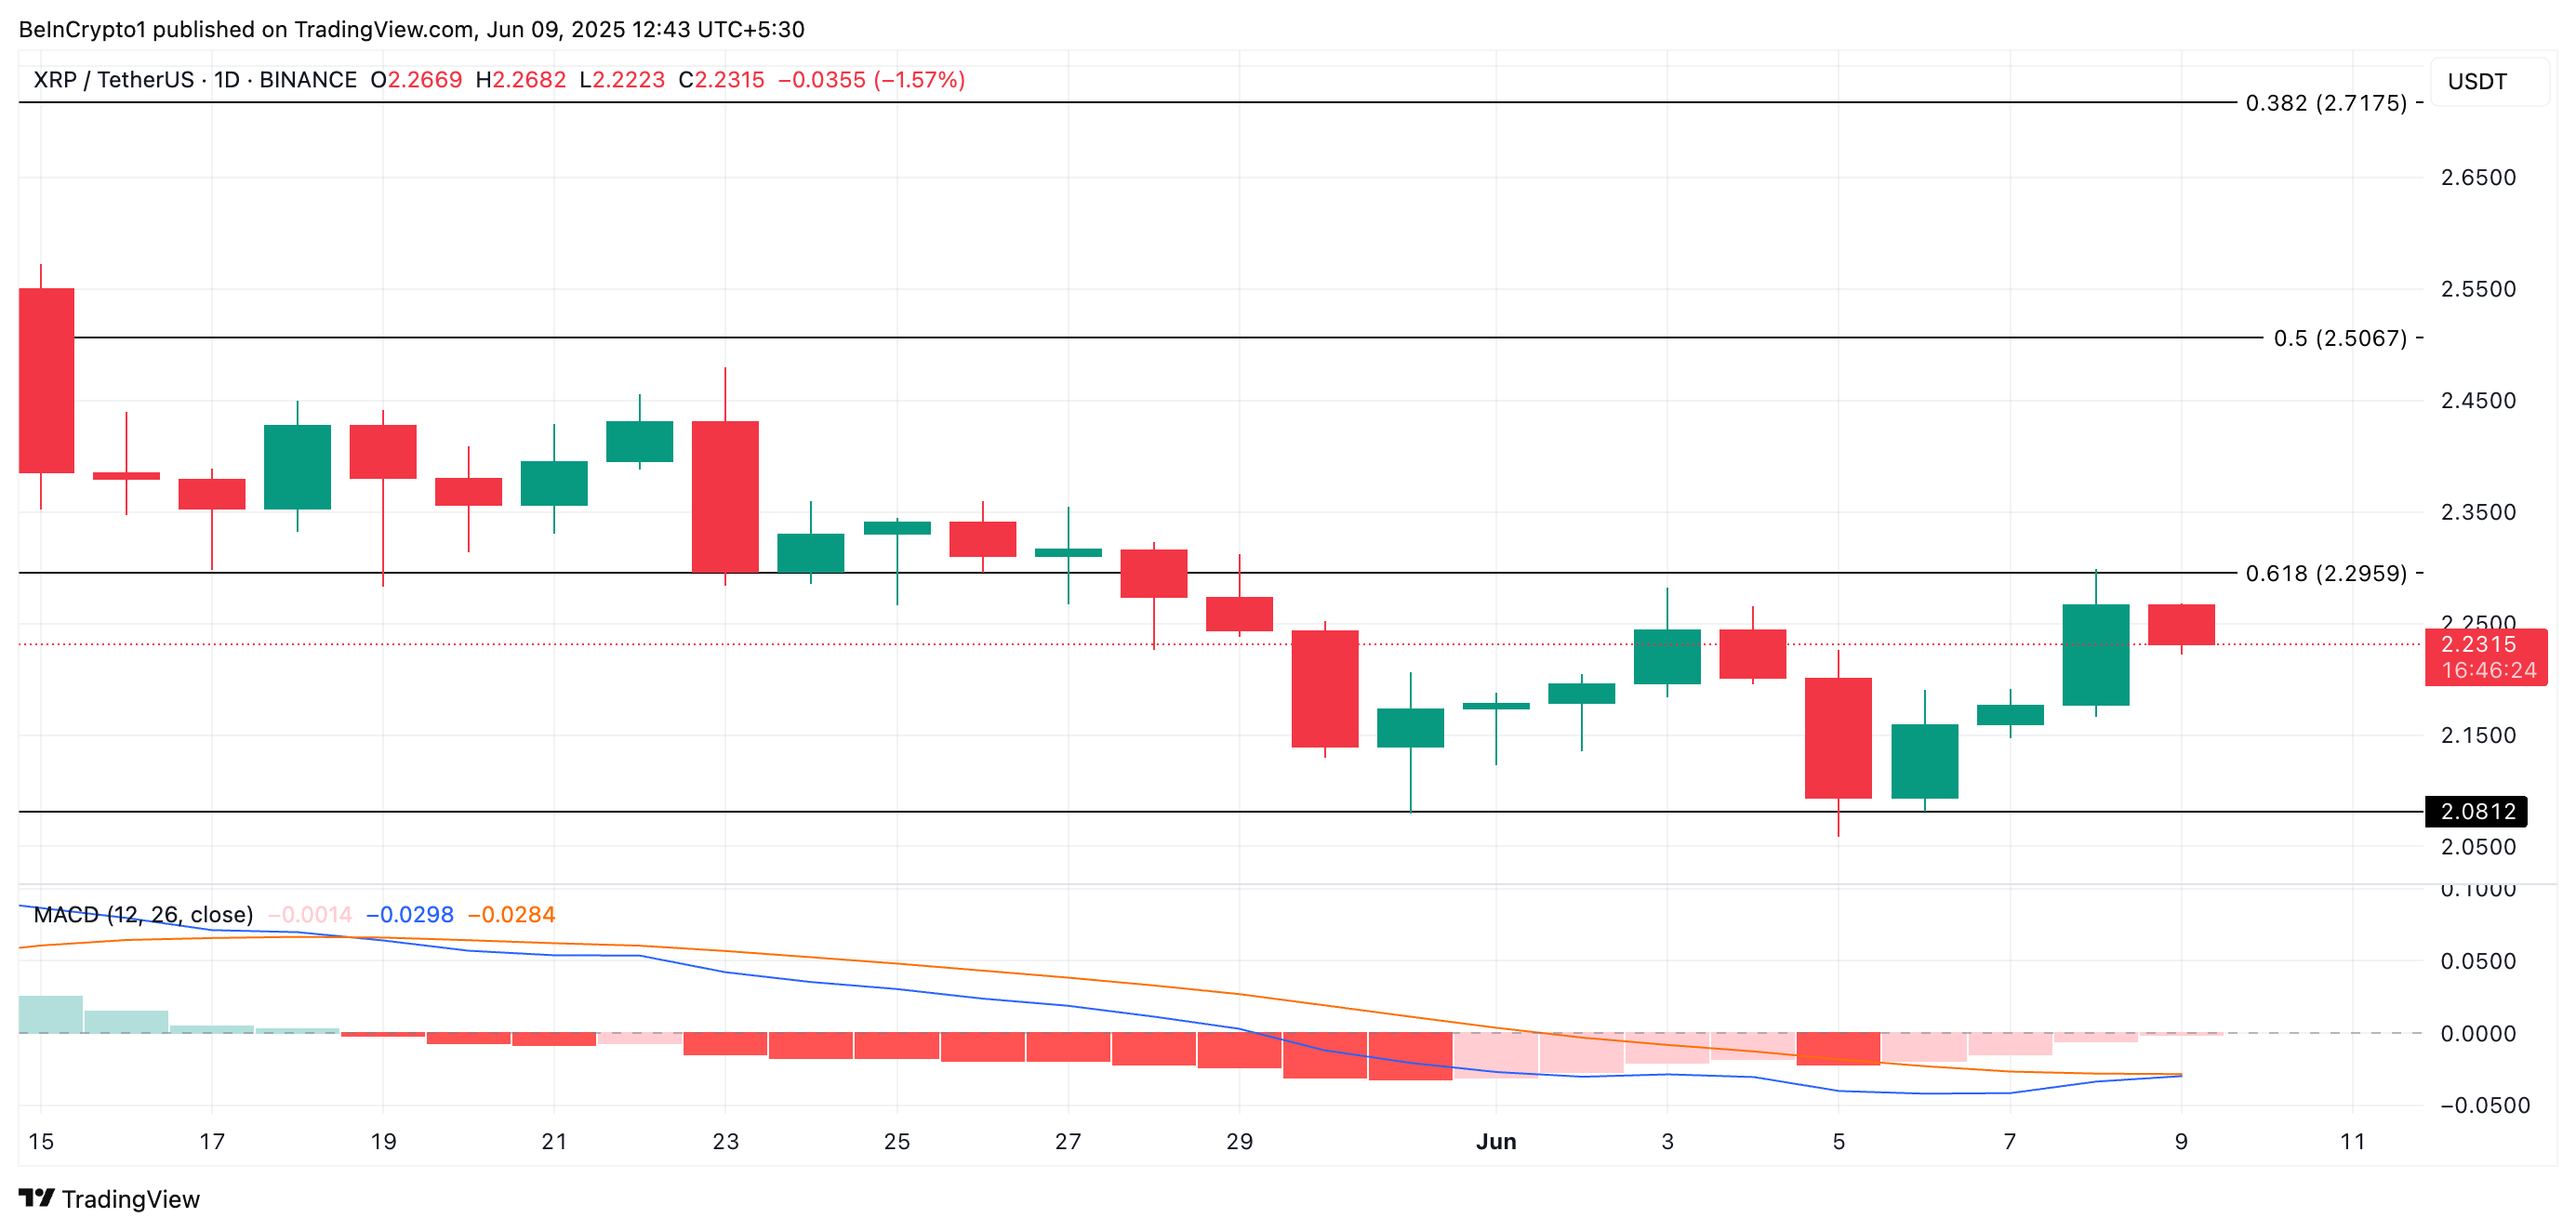 XRP Price Analysis. Source:
TradingView
On the other hand, a bearish resurgence could cause the altcoin to lose some gains and fall to $2.08.
Disclaimer: The content of this article solely reflects the author's opinion and does not represent the platform in any capacity. This article is not intended to serve as a reference for making investment decisions.
You may also like
The "split season" in 13F: Chinese concept stocks are collectively increased, Nvidia becomes the single stock with the most divergent opinions
As the third quarter of 2026 13F disclosures comes to an end, a seemingly contradictory picture of holdings emerges.
Amphenol’s Q3 revenue grows by 24%, launches its first $1 billion-level buyback after US stock listing
Amer Sports, the parent company of Arc'teryx, has announced its first $1 billion stock buyback plan since its US stock market listing, with further details to follow.
IPO Frenzy! Early VCs of Anthropic Achieve Returns of Over 10x

Nvidia’s better-than-expected performance boosts Asia-Pacific stocks, South Korean stocks once surge over 3%, SK Hynix rises more than 5%, and gold falls 1%
After the US stock market closed, Nvidia's stock price surged, with gains at one point approaching 5%. The Korea Composite Stock Price Index once rose over 3% on Wednesday, leading Asia-Pacific markets. The MSCI Asia-Pacific Stock Index rose 0.3%, snapping a four-day losing streak. The Nikkei 225 Index's gains widened to 1.1% at one point, boosted by better-than-expected October export data from Japan. WTI crude oil fell 0.5%, giving back all of the previous night's rebound. Spot gold accelerated its decline by over 1% after breaking below the 3840 support level.

Crypto prices
More


