
HBAR Technical Charts Spook Traders – Is Bullishness Fading for Hedera?

HBAR’s price faces significant pressure, with technical indicators pointing to further declines. Watch the $0.172 resistance and $0.163 support for potential price shifts.
HBAR has recently experienced a decline in price, as traders’ optimism fades, marking a shift towards bearish sentiment.
This downward trend, combined with fading bullish signals, suggests that the altcoin may be heading for a more prolonged period of price declines.
HBAR Traders Are Uncertain
In the past 10 days, HBAR’s funding rate has seen two shifts from positive to negative, the first occurrence in a month. This change in sentiment signals that traders are adjusting their positions, favoring short positions over long ones.
The increasing dominance of shorts indicates that market participants are betting on a further price drop. This shift suggests a loss of confidence among traders, who now expect a decline in HBAR’s value.
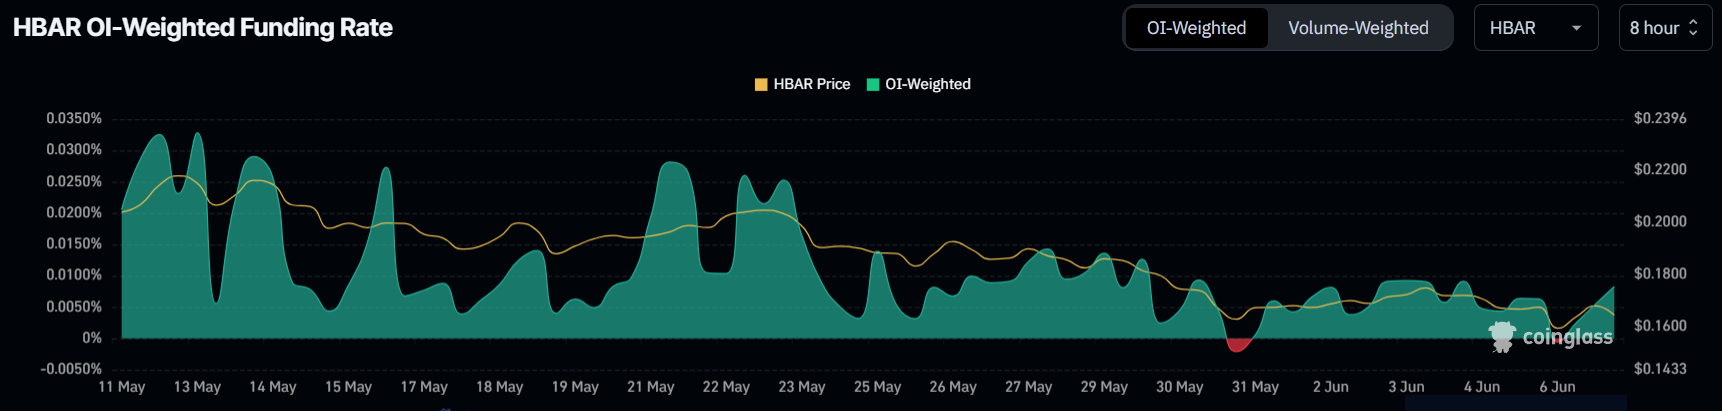 HBAR Funding Rate. Source:
Coinglass
From a macro perspective, HBAR’s technical indicators have also taken a bearish turn. The Relative Strength Index (RSI), which slipped into the bearish zone towards the end of May, reached its lowest point in two months this week.
The dip in the RSI is a strong indication that HBAR is facing growing selling pressure. As momentum weakens, the likelihood of continued declines in the price of HBAR increases.
This technical signal, coupled with the negative funding rate, suggests that HBAR may continue to struggle in the near term, with the potential for further downside if current conditions persist.
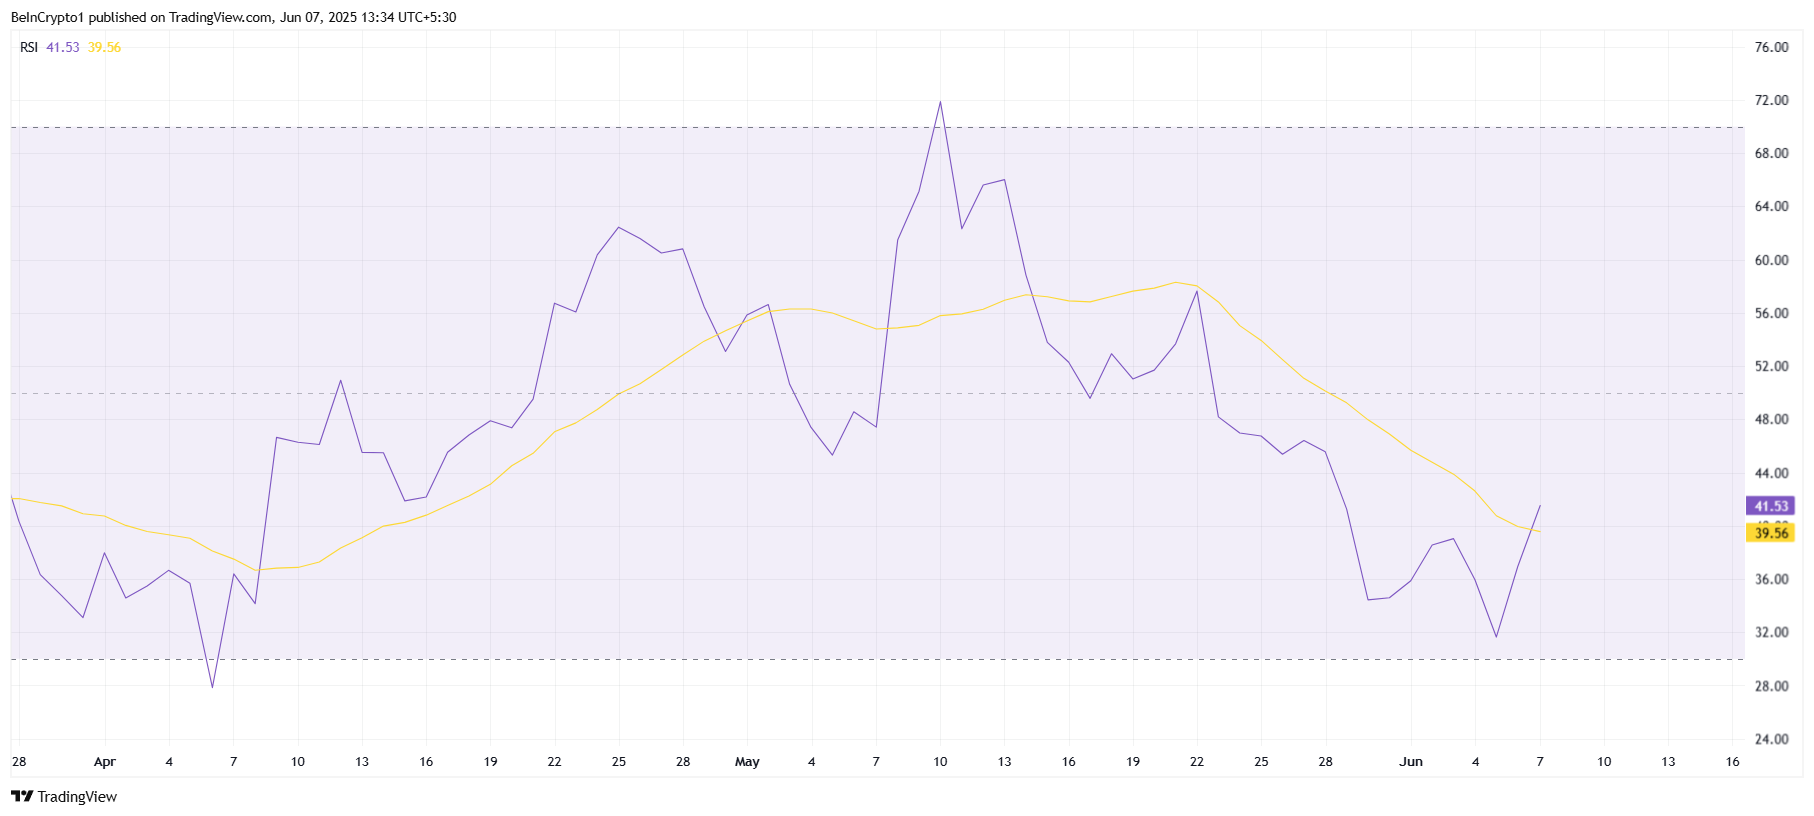 HBAR RSI. Source:
TradingView
HBAR Price Needs To Pick A Direction
Currently, HBAR is priced at $0.168, just under the resistance of $0.172. Given the mixed market sentiment, which combines bearish indicators and fading bullishness, a decline in price seems likely.
The resistance level at $0.172 remains a significant barrier for HBAR, and failure to break through this level could lead to further price weakness.
If the $0.163 support level fails to hold, HBAR could experience a further decline, possibly reaching $0.154. This drop would extend the current losses and could signal a deeper bearish trend, prompting more traders to reconsider their positions and further fueling the downtrend.
 HBAR Price Analysis. Source:
TradingView
However, if HBAR manages to break past the $0.172 resistance level, it could push toward the next resistance at $0.182.
A successful breach of this level would likely instill confidence among traders and investors, reversing the current bearish sentiment and invalidating the negative outlook for HBAR.
Disclaimer: The content of this article solely reflects the author's opinion and does not represent the platform in any capacity. This article is not intended to serve as a reference for making investment decisions.
You may also like
First 24-hour sales may reach quarterly forecasts! GTA 6 amazes Morgan Stanley
GTA 6 achieved $1.8 billion in first-day sales with approximately 19 million copies sold, breaking the record for the strongest game launch in history. The game received a score of 99 on Metacritic, surpassing The Legend of Zelda: Ocarina of Time’s 28-year record. Morgan Stanley indicated that, at the current pace, GTA 6 is likely to reach the 30 million sales target within 24 hours and maintains its Overweight rating on Take-Two.
Black Friday! Japanese and Korean stock indexes fall nearly 5%, SoftBank drops 15%, SK Hynix falls over 7%, gold falls below 3600
SK Hynix and Samsung Electronics in South Korea plunged 7% and 6% respectively, dragging the Korea Composite Index down by 4.7%. The Nikkei 225 Index fell 4.6%, with chip testing equipment maker Advantest tumbling over 9% and Tokyo Electron dropping 7%. The Japanese yen strengthened slightly by 0.23%. Spot gold fell about 1% on Friday, trading near $3,590 per ounce, with a cumulative weekly decline of over 7%.
Japan's October CPI Growth Hits Fastest This Year, Strengthening Expectations for Bank of Japan Rate Hike in December
Japan's CPI growth has reached a new high for the year, supporting expectations for an interest rate hike by the Bank of Japan.

Crypto prices
More


