- Shiba Inu breaks key support as bearish trend raises threat of a 28% price decline
- MACD and RSI indicators suggest weak momentum but hint at potential short-term recovery
- SHIB’s daily burn rate drops 63%, threatening deflation progress and long-term supply goals
Shiba Inu (SHIB) is once again in the spotlight, but not for the reasons many investors might hope. After forming a bearish technical pattern on the daily chart, SHIB has broken below a critical support level, triggering concerns about a potential 28% decline.
Despite a noticeable surge in trading activity, the token is showing signs of weakening momentum, raising red flags for short-term holders. The recent price drop comes at a time when overall market sentiment remains uncertain, adding pressure to already shaky technicals.
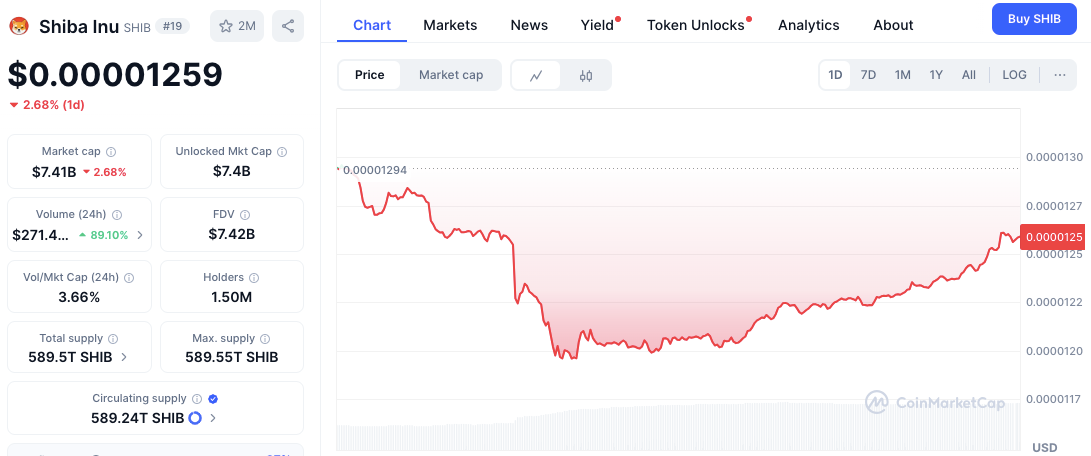
SHIB as of press time is priced at $0.00001257 , showing a 2.90% dip in the last 24 hours. The trading volume, however, soared by over 88%, suggesting heightened interest despite the decline. This spike in volume could mean a tug-of-war between bulls trying to buy the dip and bears reinforcing the downward pressure. Notably, the token formed a local bottom and started recovering briefly, but failed to breach key resistance.
Support and Resistance Levels Signal Market Struggle
The chart shows a reliable support zone between $0.00001180 and $0.00001200. This level acted as a base during SHIB’s recent sell-off and was where consolidation began. Buyers stepped in around this price range, temporarily halting further decline.
 Source: CoinMarketCap
On the flip side, resistance is building up near $0.00001294 to $0.00001300. This range marks the previous daily high, which the token failed to sustain. Sellers have shown dominance around this level, suggesting that SHIB will need a strong push to break through.
Indicators Point to Weak but Shifting Momentum
 SHIB/USD daily price chart, Source: TradingView
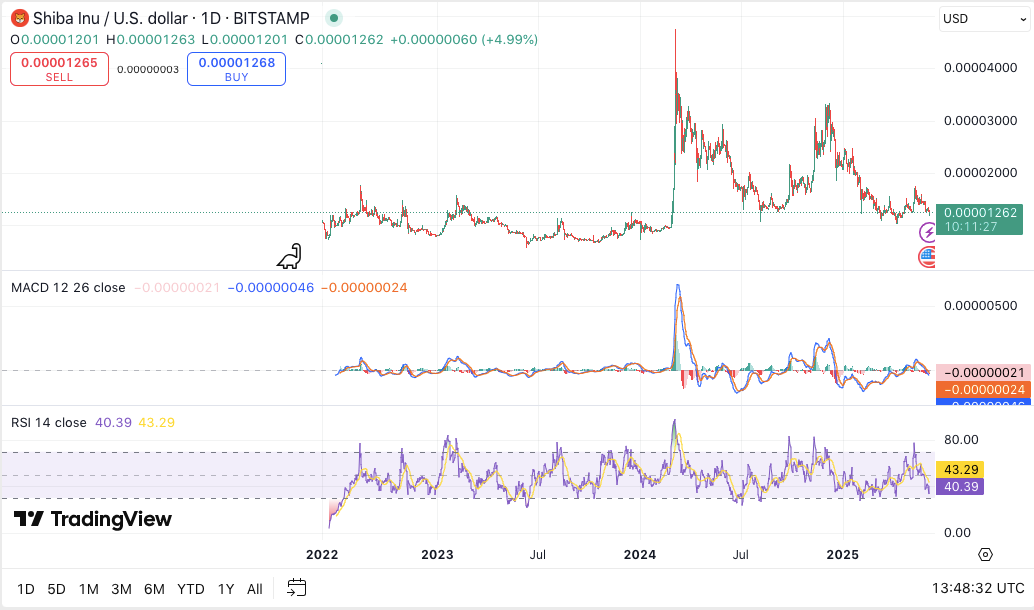
Technically, the MACD shows both the MACD and signal lines still below zero, indicating that the trend remains bearish. However, the lines are converging, hinting at a possible bullish crossover in the near future. This could slow down the decline or even trigger a short-term recovery.
The RSI sits at 39.76, just above oversold levels. It is edging closer to neutral territory. If it crosses above 50, it may confirm a brief bullish trend. Until then, sentiment remains cautious.
Token Metrics and Burn Rate Decline
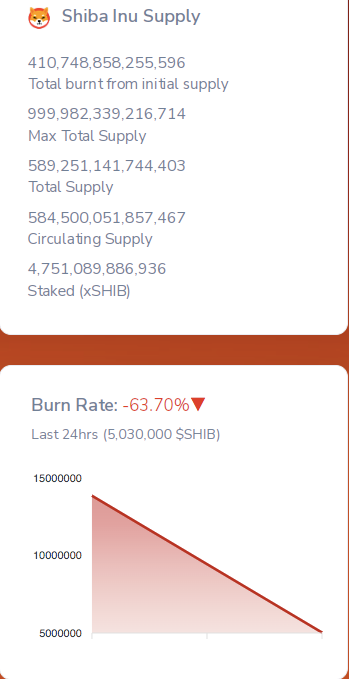
SHIB’s tokenomics show that over 410 trillion tokens have been permanently burned from its original supply. The current total supply stands at around 589 trillion, with nearly 4.75 trillion staked as xSHIB.
 Source: shibburn
Interestingly, the token burn rate has plummeted by over 63% in the last 24 hours. Only about 5 million SHIB tokens were burned during that time. This slowdown in burn activity may impact long-term supply reduction efforts, especially if demand doesn’t pick up.
Disclaimer: The information presented in this article is for informational and educational purposes only. The article does not constitute financial advice or advice of any kind. Coin Edition is not responsible for any losses incurred as a result of the utilization of content, products, or services mentioned. Readers are advised to exercise caution before taking any action related to the company.