
XRP Traders Bet on Reversal as Demand Builds at Key Support

Despite a recent 4% dip, XRP shows signs of a rebound fueled by strong trader interest and bullish technical indicators. Liquidation targets at $2.48 may drive near-term price action
XRP has slipped 4% over the past week amid a broader market pullback. As of this writing, the fourth-largest cryptocurrency by market capitalization trades at $2.31.
Amid strengthening bearish bias across the general market, on-chain data hints at a near-term rebound.
XRP Gears Up for Potential Rally
According to Coinglass, XRP’s liquidation heatmap shows a notable concentration of liquidity at the $2.48 price zone.
Liquidation heatmaps are visual tools traders use to identify price levels where large clusters of leveraged positions are likely to be liquidated. These maps highlight areas of high liquidity, often color-coded to show intensity, with brighter zones representing larger liquidation potential.
Usually, these price zones act as magnets for price action, as the market tends to move toward these areas to trigger liquidations and open fresh positions.
Therefore, for XRP, the cluster of liquidity at the $2.48 price level signals strong trader interest in buying or closing short positions at that price. This opens the door for a potential price rally in the near term.
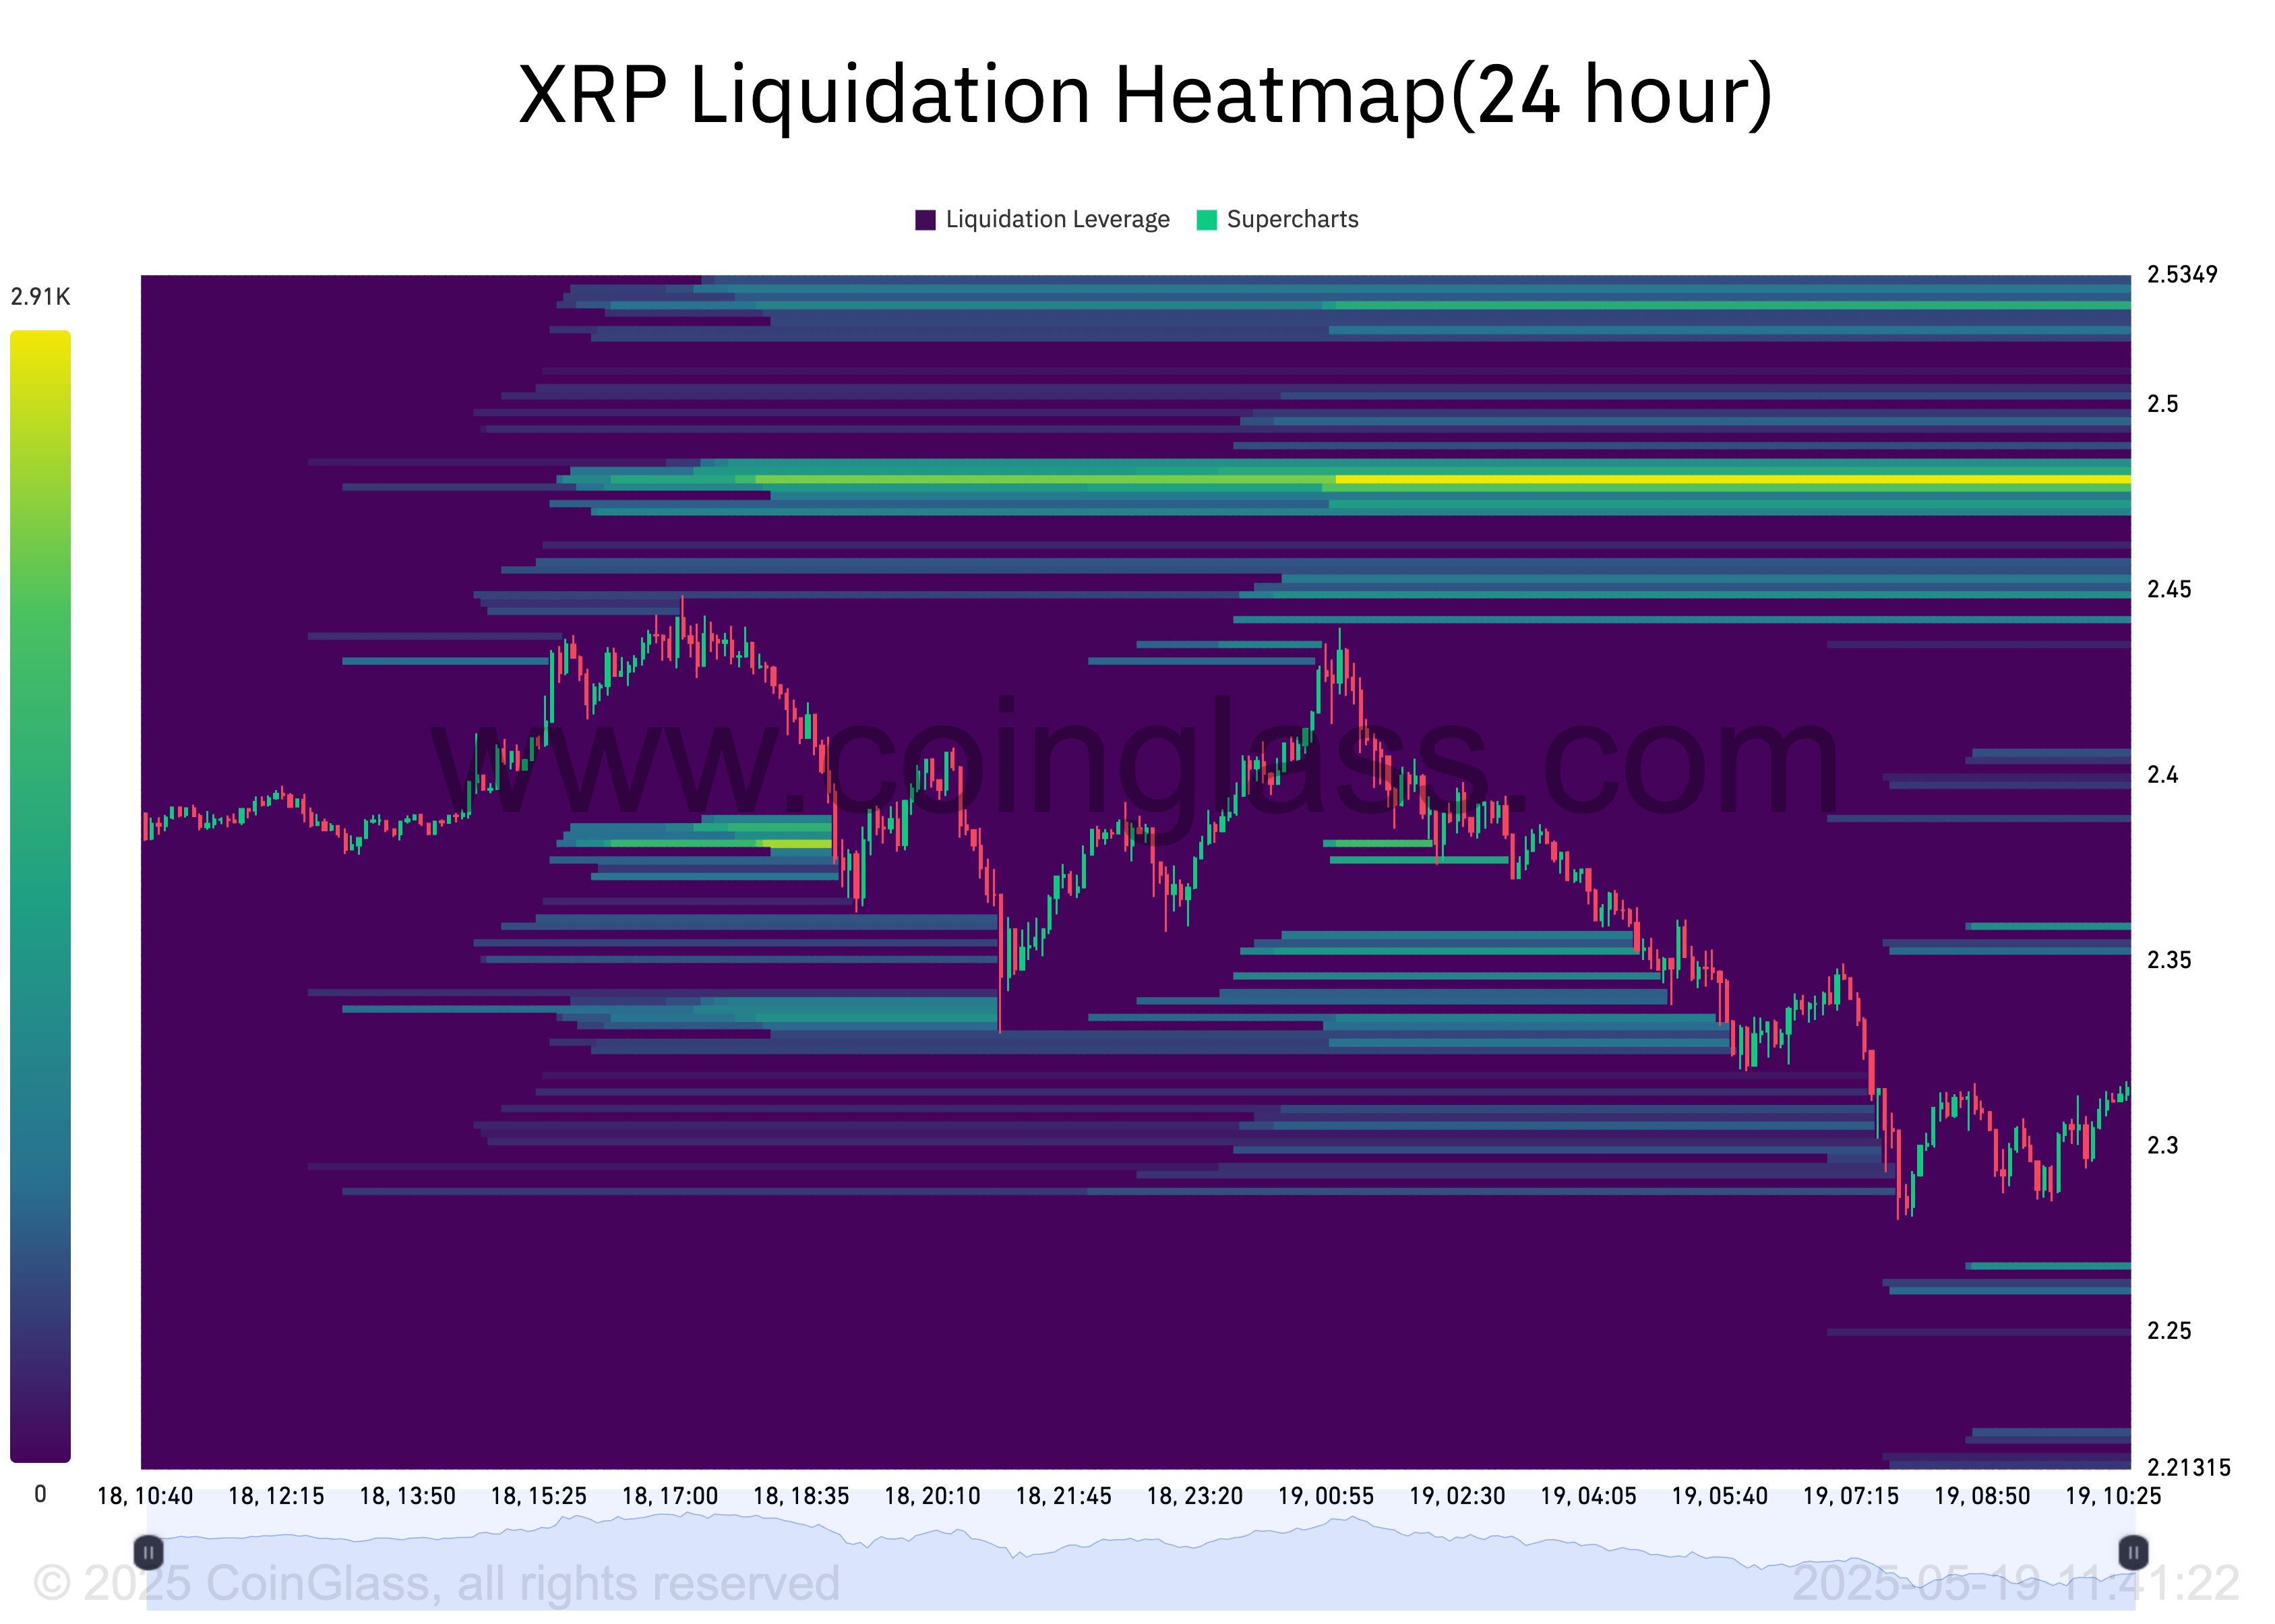 XRP Liquidation Heatmap. Source:
Coinglass
Further, the altcoin’s funding rate has remained positive despite its recent headwinds. Currently, this stands at 0.0041%.
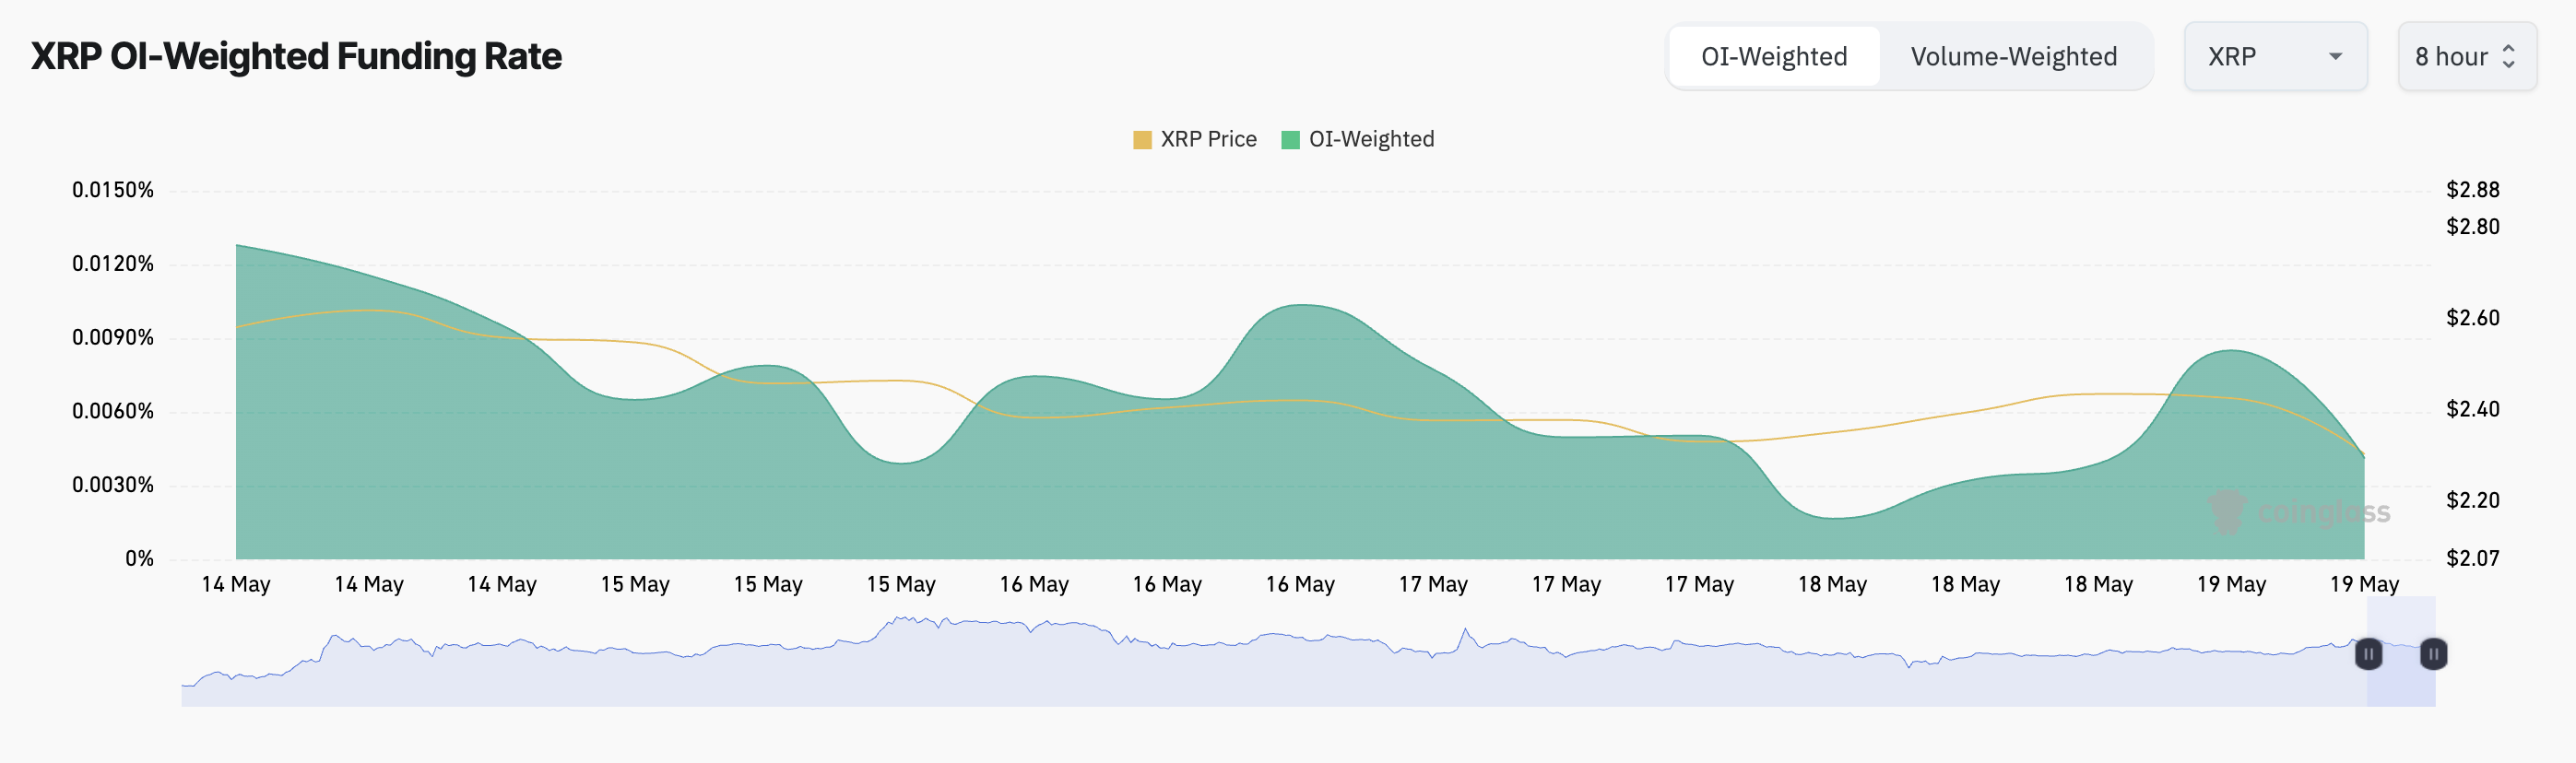 XRP Funding Rate. Source:
Coinglass
The funding rate is a periodic payment between traders in perpetual futures contracts to keep the contract price aligned with the spot price. When the funding rate is positive, there is a higher demand for long positions. This means that more traders are betting on XRP’s price going up.
XRP Bulls Take Charge
On the daily chart, XRP’s Directional Movement Index (DMI) highlights the growing demand for the altcoin. At press time, the token’s positive directional index (+DI) rests above the negative directional index (-DI).
The DMI indicator measures the strength of an asset’s price trend. It consists of two lines: the +DI, which represents upward price movement, and the -DI, which means downward price movement.
As with XRP, the market trend is bullish when the +DI rests above the -DI. If this persists, the token’s price could surge to $2.50.
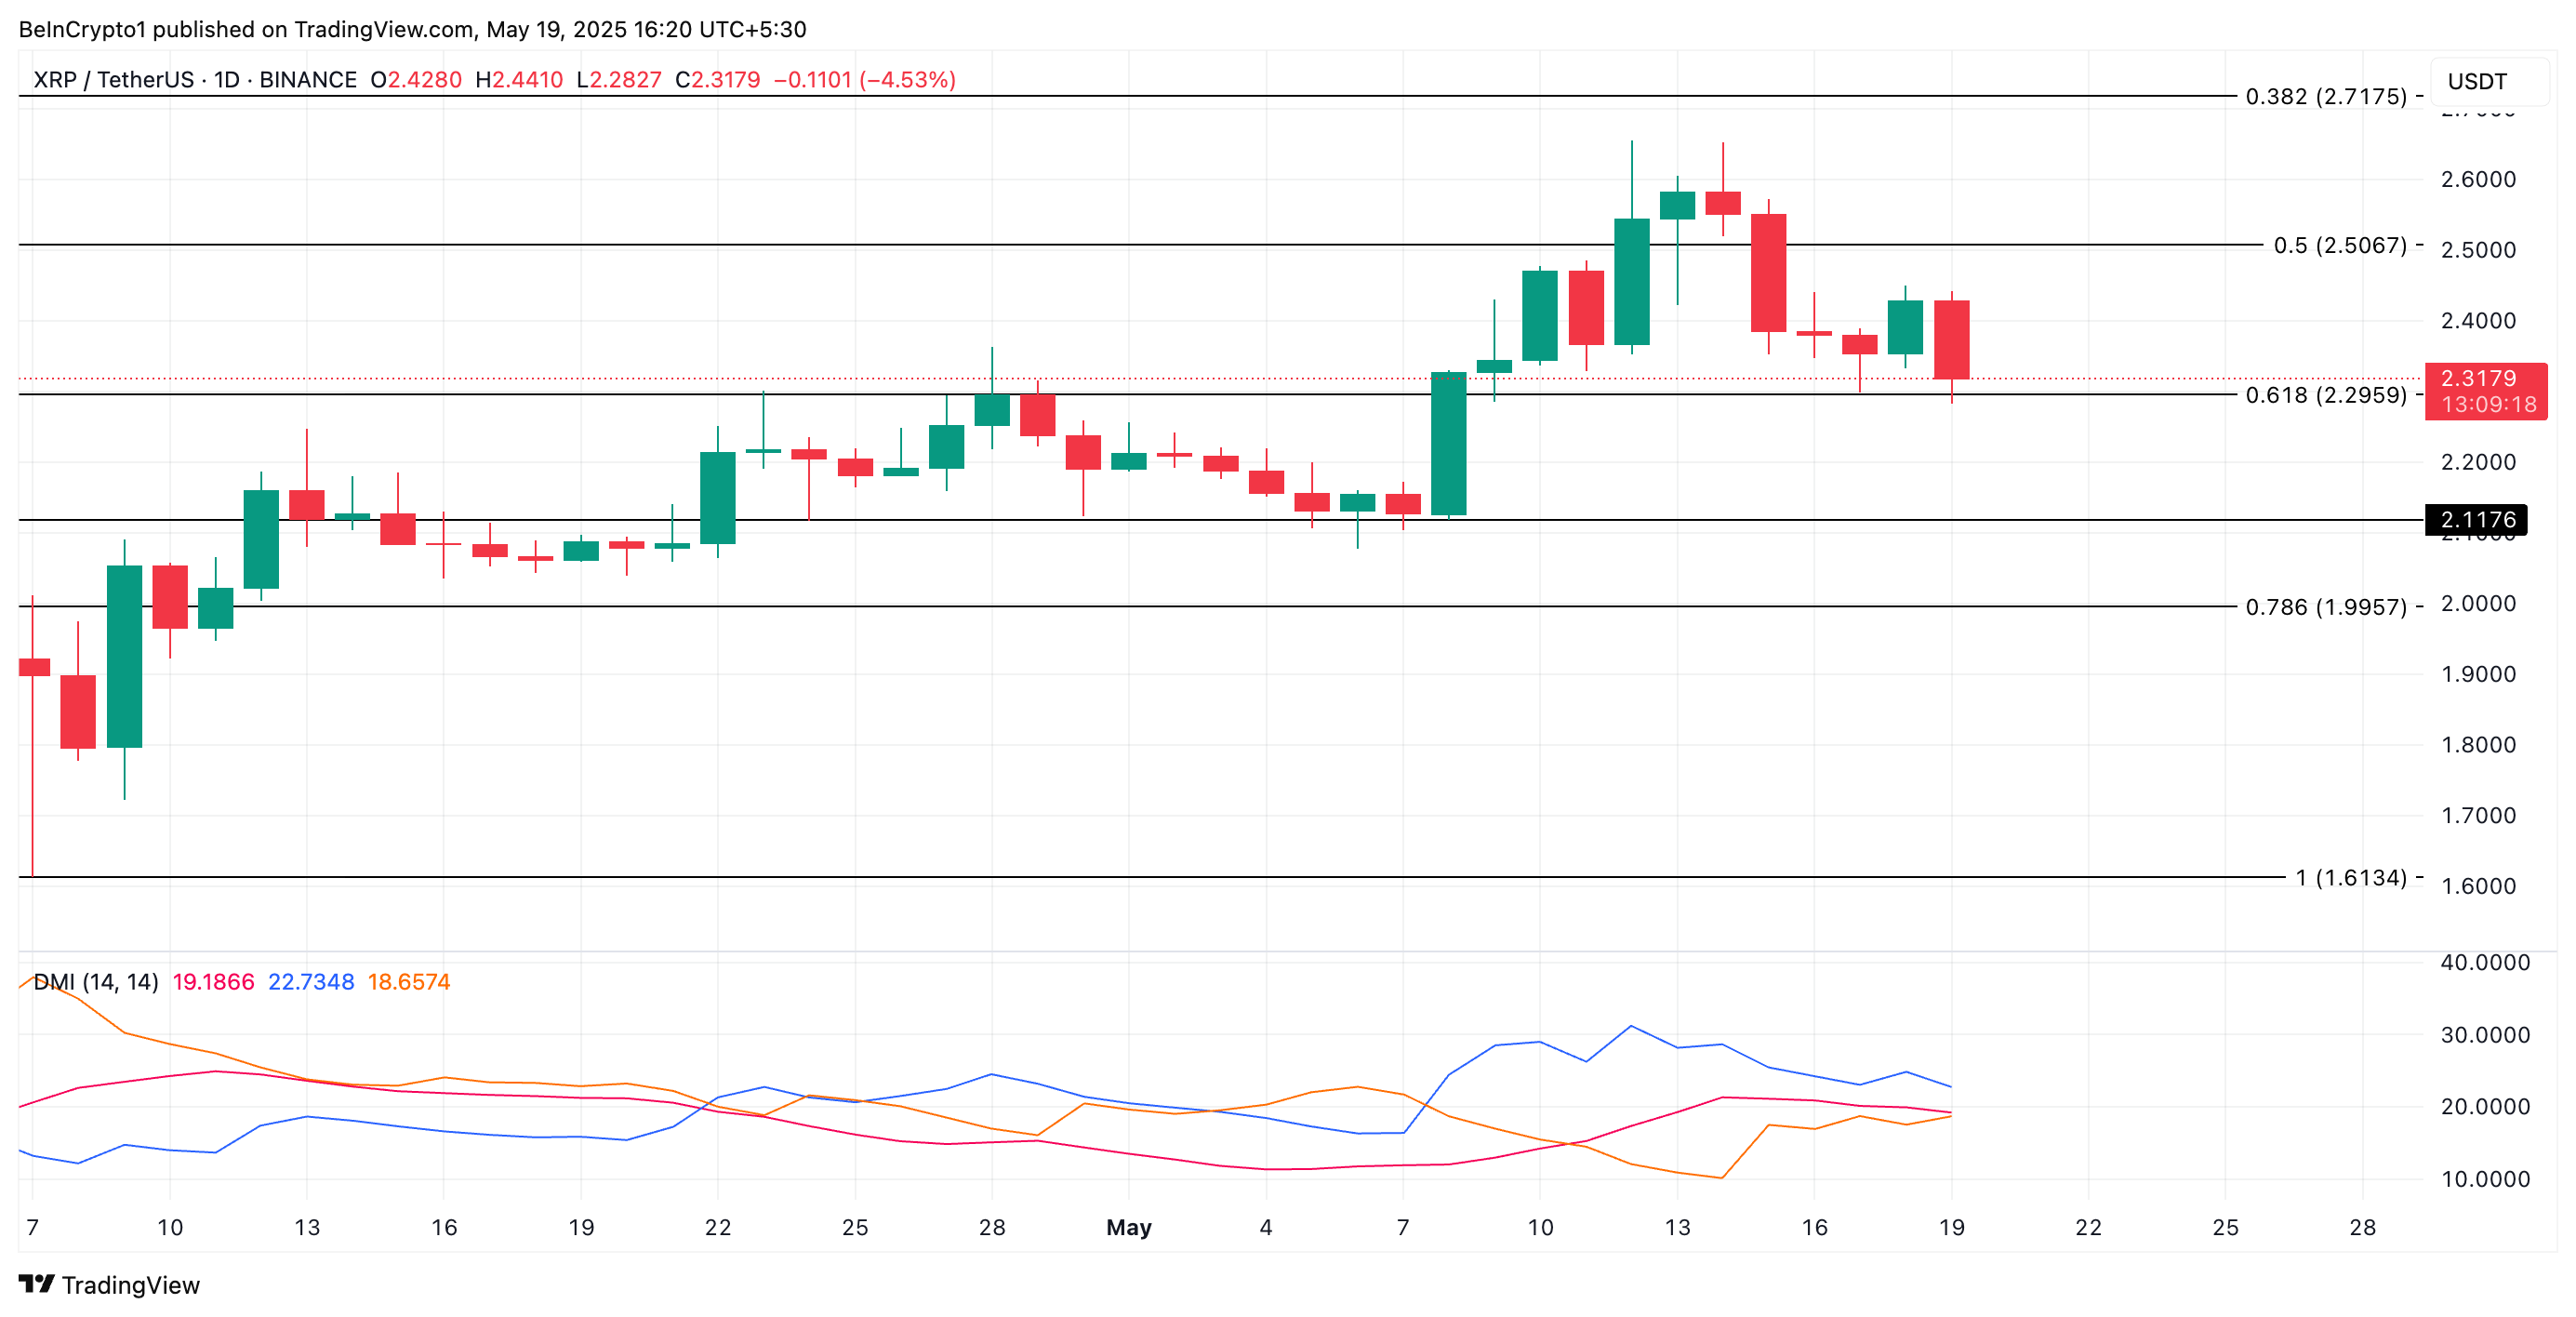 XRP Price Analysis. Source:
TradingView
However, if the XRP token price drop continues, its value could fall below $2.29, and trend toward $2.11.
Disclaimer: The content of this article solely reflects the author's opinion and does not represent the platform in any capacity. This article is not intended to serve as a reference for making investment decisions.
You may also like
On Anthropic's first day of listing, retail trading volume hit a record high, but nearly half of the trades were sells!
On its first day of listing, Anthropic saw a total retail trading volume of $772 million, setting a new historical high. However, nearly half of the transactions were sell orders, with net buying amounting to only $60 million, far below the expected $250 million. Dragged down by the overall market decline, a high proportion of retail profit-taking, and funds diverted in advance to crypto perpetual contracts, the stock opened high but closed lower. Going forward, it still faces potential selling pressure from a significant amount of low-priced retail holdings.
Shorts are running wild, gold urgently needs a catalyst to break the tightening narrative!
Deutsche Bank has issued a warning that macro funds and CTA strategies have maintained "maximum short positions" in gold for several weeks, and there is still ample room for further shorting. The key contradiction lies in the fact that ETF holdings remain stable, central banks continue to increase their gold reserves, and there are no signs of physical selling. However, financial positioning effects have completely disconnected the price from fundamentals. Analysts believe that gold’s sensitivity to the US dollar is approaching levels not seen since 1972, and technical analysis points to $3,500. A resolution will require one of three catalysts: a dovish turn by the Federal Reserve, weakening economic data, or cracks appearing in the broader market.
Ross Stores (ROST.US) Q3 Conference Call: 8% Same-Store Sales Growth on a High Base, CEO Says Traffic Drives an Extremely Healthy "Growth Flywheel"
After releasing its third-quarter fiscal 2026 results (ending October 31) after the U.S. market closed on November 19, Ross Stores, the American discount apparel and home goods retailer, held an earnings conference call.
Crypto prices
More


