
Will TRX Finally Break $0.25?

TRON (TRX) might not be dominating headlines, but its recent chart behavior says something is brewing beneath the surface. After weeks of tight consolidation, TRX is testing key resistance levels that could trigger the next major move. With on-chain momentum picking up and price hugging crucial moving averages, traders are starting to wonder — is TRON price about to wake up?
Let’s take a closer look at what the charts are revealing right now.
TRON Price Prediction: A Slow Grind Toward the Breakout Zone
 TRX/USD Daily Chart- TradingView
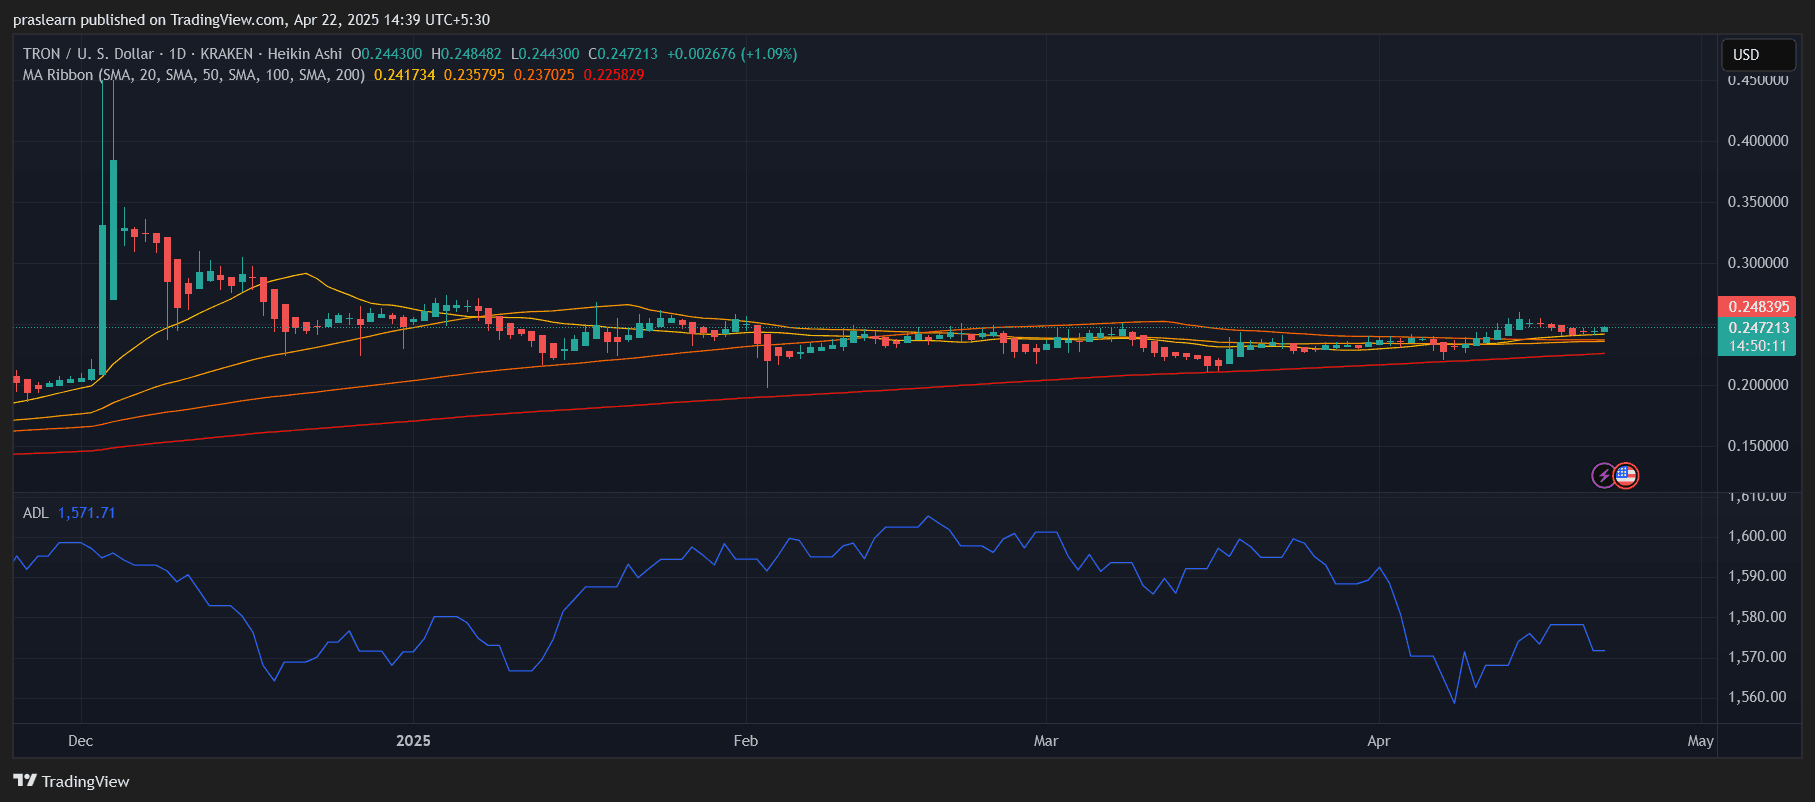
On the daily chart, TRX has been moving in an incredibly tight range , floating between $0.235 and $0.248 for most of April. This sideways action, while frustrating for traders, has served a critical purpose: it’s allowed TRON to base itself above the 200-day simple moving average (SMA), now sitting at $0.225. That’s a bullish sign of longer-term strength.
TRON Price is currently testing resistance at $0.248 , just under the 20-day SMA ($0.2417) and 50-day SMA ($0.2357). With the 100-day SMA now sitting at $0.2370 and the moving averages flattening, a crossover may be setting up in TRX’s favor. Momentum appears to be quietly shifting — and the Accumulation/Distribution Line (ADL), sitting at 1,571.71, is starting to recover from its April dip.
Hourly Chart Shows Pressure Building
 TRX/USD ! Hr Chart- TradingView
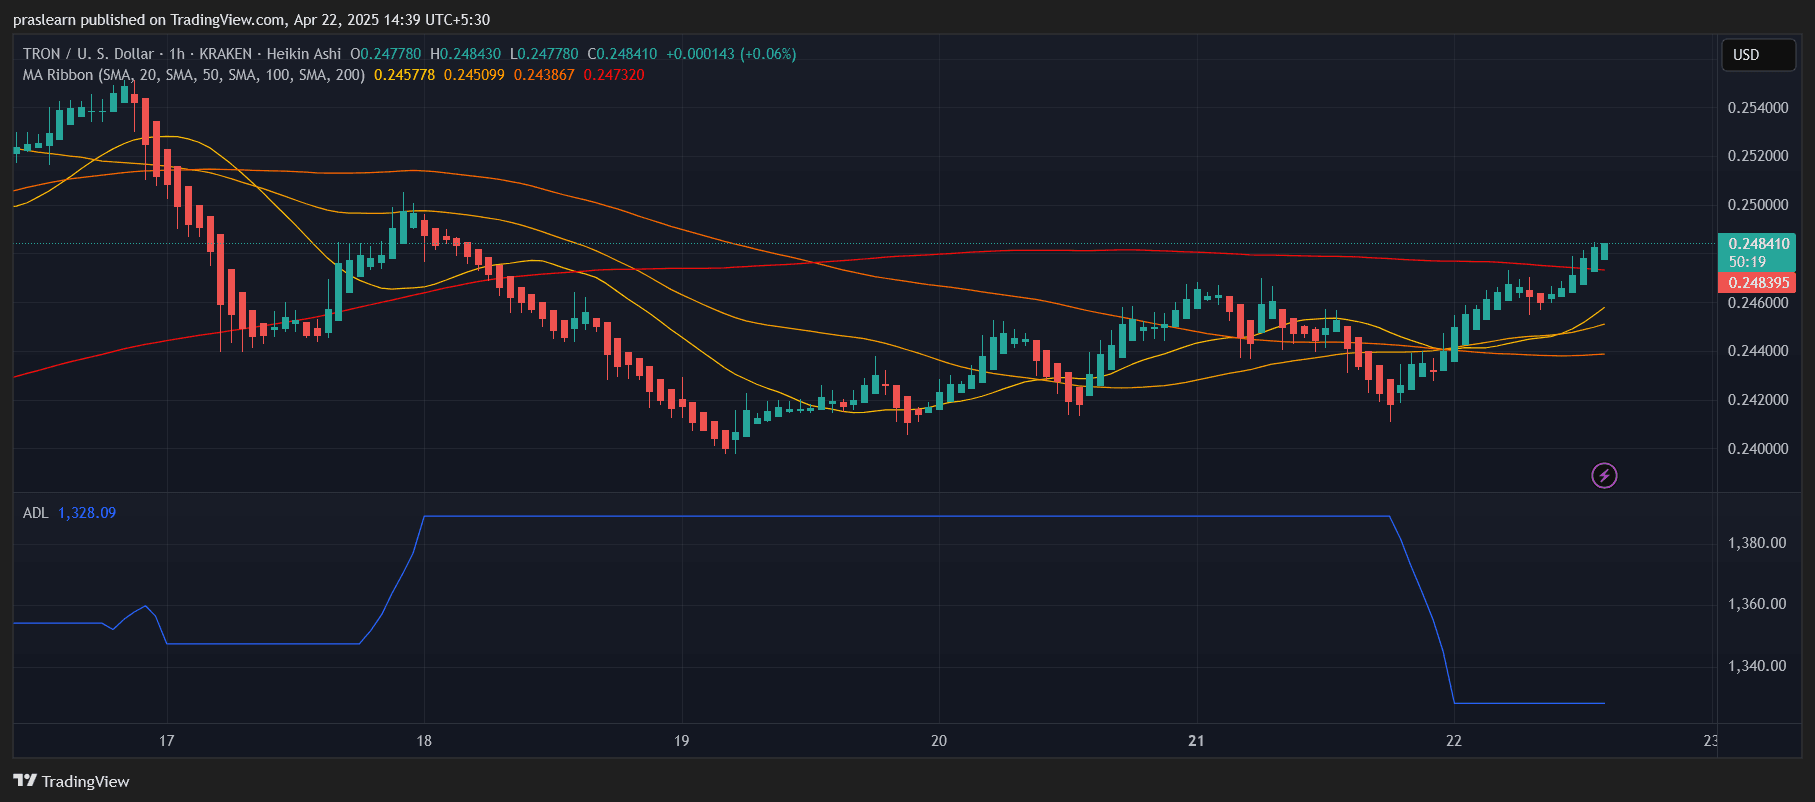
The hourly chart is more energetic. TRX price recently reclaimed its 200-hour SMA and is now printing consistent green candles just under $0.248. A breakout above this level, if paired with volume, could push price toward the $0.255–$0.260 range quickly.
What stands out is how cleanly TRX price has moved above all short-term moving averages (20, 50, 100-hour), with the hourly ADL rising to 1,328.09. This suggests that the recent rally isn’t just retail-driven — there's sustained accumulation from larger hands taking place.
If bulls can push through $0.25 and confirm a breakout, it would break the consolidation pattern that’s capped TRX for nearly a month.
What’s Driving the Quiet Strength?
TRON's lack of hype could actually be its strength. While other altcoins have suffered from speculative boom-bust cycles, TRX has steadily maintained technical support and has continued expanding its ecosystem — especially in the DeFi and stablecoin sectors across Asia.
With market focus shifting back to solid Layer 1s and utility-driven projects, TRON might be positioned for a catch-up rally. The consistent hold above the 200-day SMA supports this narrative, and technicals suggest bulls are slowly but surely regaining control.
TRON Price Prediction: What Happens Next?
If TRON price successfully closes above $0.25 on the daily timeframe, the next resistance levels are $0.265 and $0.278 — both of which acted as key rejection points earlier this year. Breaking above $0.278 would open up space for a run toward $0.30, a level that hasn't been tested since early January.
However, failure to break and hold above $0.25 could send TRX price back to retest its support near $0.237 or even the 200-day SMA at $0.225. The next 48 hours will be crucial for confirming whether this rally has real legs.
Final Thoughts: A Sleeper Altcoin Gearing Up?
TRON isn’t the flashiest coin in the market, but its technical setup looks healthier than most. With price holding above major moving averages, volume gradually increasing, and accumulation picking up again, the foundation for a larger breakout is forming.
While the market watches other trendier tokens, TRX price may be the quiet underdog getting ready to surprise everyone. If it breaks past $0.25 with conviction, don’t be shocked if $0.30 comes into view sooner than expected.
TRON (TRX) might not be dominating headlines, but its recent chart behavior says something is brewing beneath the surface. After weeks of tight consolidation, TRX is testing key resistance levels that could trigger the next major move. With on-chain momentum picking up and price hugging crucial moving averages, traders are starting to wonder — is TRON price about to wake up?
Let’s take a closer look at what the charts are revealing right now.
TRON Price Prediction: A Slow Grind Toward the Breakout Zone
TRX/USD Daily Chart- TradingView
On the daily chart, TRX has been moving in an incredibly tight range , floating between $0.235 and $0.248 for most of April. This sideways action, while frustrating for traders, has served a critical purpose: it’s allowed TRON to base itself above the 200-day simple moving average (SMA), now sitting at $0.225. That’s a bullish sign of longer-term strength.
TRON Price is currently testing resistance at $0.248 , just under the 20-day SMA ($0.2417) and 50-day SMA ($0.2357). With the 100-day SMA now sitting at $0.2370 and the moving averages flattening, a crossover may be setting up in TRX’s favor. Momentum appears to be quietly shifting — and the Accumulation/Distribution Line (ADL), sitting at 1,571.71, is starting to recover from its April dip.
Hourly Chart Shows Pressure Building
TRX/USD ! Hr Chart- TradingView
The hourly chart is more energetic. TRX price recently reclaimed its 200-hour SMA and is now printing consistent green candles just under $0.248. A breakout above this level, if paired with volume, could push price toward the $0.255–$0.260 range quickly.
What stands out is how cleanly TRX price has moved above all short-term moving averages (20, 50, 100-hour), with the hourly ADL rising to 1,328.09. This suggests that the recent rally isn’t just retail-driven — there's sustained accumulation from larger hands taking place.
If bulls can push through $0.25 and confirm a breakout, it would break the consolidation pattern that’s capped TRX for nearly a month.
What’s Driving the Quiet Strength?
TRON's lack of hype could actually be its strength. While other altcoins have suffered from speculative boom-bust cycles, TRX has steadily maintained technical support and has continued expanding its ecosystem — especially in the DeFi and stablecoin sectors across Asia.
With market focus shifting back to solid Layer 1s and utility-driven projects, TRON might be positioned for a catch-up rally. The consistent hold above the 200-day SMA supports this narrative, and technicals suggest bulls are slowly but surely regaining control.
TRON Price Prediction: What Happens Next?
If TRON price successfully closes above $0.25 on the daily timeframe, the next resistance levels are $0.265 and $0.278 — both of which acted as key rejection points earlier this year. Breaking above $0.278 would open up space for a run toward $0.30, a level that hasn't been tested since early January.
However, failure to break and hold above $0.25 could send TRX price back to retest its support near $0.237 or even the 200-day SMA at $0.225. The next 48 hours will be crucial for confirming whether this rally has real legs.
Final Thoughts: A Sleeper Altcoin Gearing Up?
TRON isn’t the flashiest coin in the market, but its technical setup looks healthier than most. With price holding above major moving averages, volume gradually increasing, and accumulation picking up again, the foundation for a larger breakout is forming.
While the market watches other trendier tokens, TRX price may be the quiet underdog getting ready to surprise everyone. If it breaks past $0.25 with conviction, don’t be shocked if $0.30 comes into view sooner than expected.
Disclaimer: The content of this article solely reflects the author's opinion and does not represent the platform in any capacity. This article is not intended to serve as a reference for making investment decisions.
You may also like
US PPI report to test Bitcoin, gold and Nasdaq as December rate hike looms
Nvidia falls to its lowest valuation in 14 years! "Super bull" Tom Lee calls for bottom fishing, retail investors are buying more as it drops, but Wall Street is divided
After the market opened on Thursday, retail investors went against the trend and bought up Nvidia, with net purchases reaching $111 million in just half an hour, setting a record for the same period. Investors such as Tom Lee have publicly supported the company, with institutions optimistic about strong order backlogs extending to 2028, robust revenue growth, and opportunities created by declining valuations. Meanwhile, institutions like Bernstein and Goldman Sachs have become more cautious about Nvidia's outlook, with concerns focusing on management succession and technological leadership following Jensen Huang's departure.
Jane Street boosts Fidelity Bitcoin ETF stake 8x in Q3, trims BlackRock IBIT

From SpaceX to Anthropic, the market has new strategies for dealing with tech giants' IPOs
The market's response strategies to major listings are currently centered around "index inclusion expectations": the new regulations allow mega IPOs to be included in the six major indices within 15 days, triggering concentrated buying by passive funds. Investors are positioning themselves in advance and using options to hedge and amplify buying power. However, Anthropic has a free float of only about 6%; shares available for sale by employees on the first day and privately placed shares with no lock-up period may create supply pressure. On the other hand, index arbitrageurs are facing a rare opportunity.

Crypto prices
More


