
How Low Can Ethereum Price Go in April? Crash Fears Grip Crypto Investors

Ethereum (ETH) , the world’s second-largest cryptocurrency, is caught in the crossfire of a global selloff triggered by tariff war tensions. With President Trump’s aggressive tariff measures shaking up global markets, crypto is once again proving it's not immune to macroeconomic chaos. As ETH plunges below critical levels, traders are scrambling to assess the damage and ask the all-important question: How low can Ethereum go this April?
A close analysis of Ethereum's daily and hourly charts offers insight into just how vulnerable the asset has become—and whether a reversal is even possible in the near term.
Ethereum Price Prediction: What Is the Daily Chart Signaling About Ethereum’s Trend?
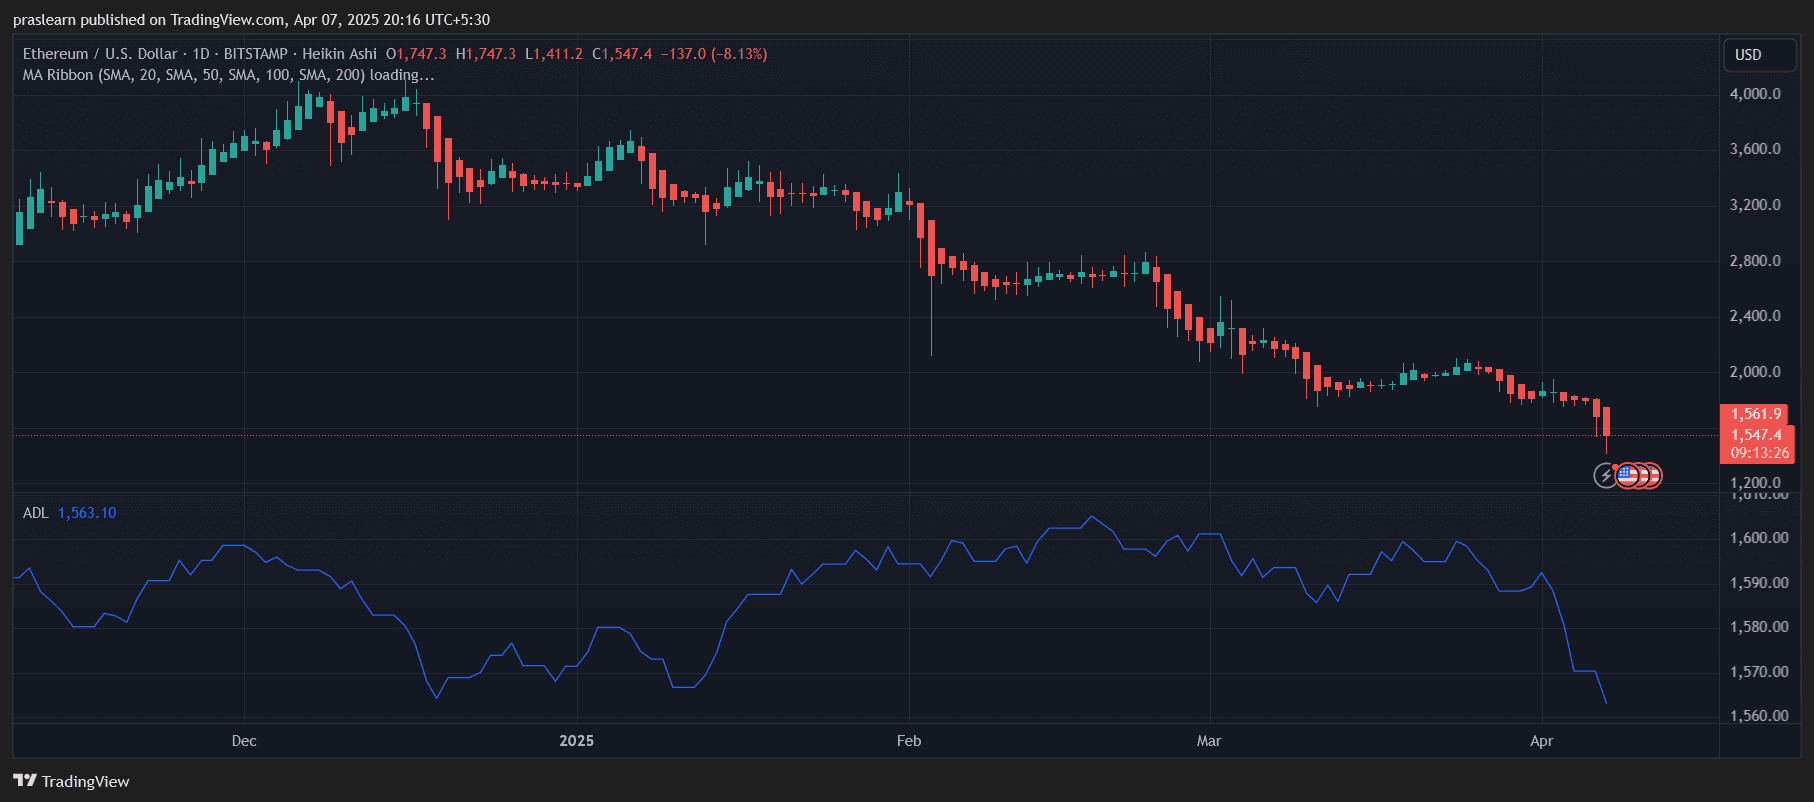 ETH/USD Daily Chart- TradingView
Ethereum’s daily chart reveals a steep downtrend that’s accelerating. The Heikin Ashi candles are printing long-bodied red bars, with little to no upper wicks—clear signs of strong bearish momentum. ETH price closed the most recent session at around $1,547, down 8.13% in a single day. That move followed several consecutive losing days, confirming not just a correction but a deeper breakdown.
The asset has fallen well below all key moving averages. While the full MA ribbon data didn’t load, it’s evident from structure and price action that Ethereum is now trading below the 200-day SMA, which typically serves as a critical support level for long-term investors. Breaking that line is historically a red flag for extended bearish periods.
The Accumulation/Distribution Line (ADL) adds to the worry. It's in sharp decline, confirming that smart money isn’t stepping in to buy this dip. Without accumulation, it’s unlikely Ethereum can stage a meaningful reversal in the coming days.
Can the Hourly Chart Give Bulls Any Hope?
 ETH/USD 1 Hr Chart- TradingView
On the hourly chart, Ethereum has shown a small bounce off the recent low near $1,411, rising back to $1,571 at the time of writing. While this may seem like a bullish reaction, the rebound came after an extended downward cascade and is still under all major moving averages—including the 20, 50, 100, and 200 SMAs. The 200 SMA at $1,794 is particularly distant, showing how stretched the price is to the downside.
Heikin Ashi candles on the hourly timeframe have turned green, but only recently and without strong upward momentum. The recent candle spike suggests a short squeeze or profit-taking rather than real trend reversal. The ADL here remains flat to declining, indicating no real accumulation even on short timeframes.
In short, the hourly chart offers a temporary pause in selling, not a reliable sign of bullish recovery.
Where Are the Key Support and Resistance Levels for Ethereum?
Ethereum’s next major support level is $1,400, which held up in the most recent drop. If this level breaks again under stronger selling pressure, the next targets lie near $1,320 and $1,200, zones that previously acted as demand during the 2022–2023 bear market.
On the upside, Ethereum must reclaim $1,685 (the 50 SMA on the hourly chart) to neutralize the short-term trend. But the real shift in momentum would only occur above $1,800, where the 200 SMA and key resistance converge. Without those levels being broken, rallies remain suspect and vulnerable to quick rejection.
What Are the Chart Indicators Telling Us?
Moving Averages: ETH price is trading below all major moving averages across both timeframes, with the downward-sloping nature of the SMAs reinforcing the bearish momentum. This alignment usually precedes further downside unless invalidated by volume-backed breakouts.
Heikin Ashi Candles: Daily candles are extremely bearish, and while hourly candles have shown a bounce, the lack of consistency and volume weakens any bullish interpretation. Bulls need to see smaller-bodied, higher low candles to confirm reversal, which haven’t formed yet.
ADL (Accumulation/Distribution Line): The ADL on both charts is trending down, which is among the most troubling signs. A falling ADL during price dips suggests that whales and institutions are exiting, not accumulating—bad news for bullish continuation.
Ethereum Price Prediction: How Low Could It Go in April?
If bearish momentum persists and $1,400 breaks, Ethereum price could retrace to $1,200 or even $1,000 in April, particularly if macro fears escalate and crypto sentiment weakens. This would mark a full capitulation move and potentially form a long-term bottom.
However, if ETH stabilizes above $1,500 and starts to reclaim $1,685–$1,700, a short-term relief rally to $1,800–$1,850 could be on the table. But without strong volume and a rising ADL, even such a rally would be vulnerable to rejection.
Is Ethereum Headed for a Deeper Collapse?
Ethereum is at a critical juncture . With its long-term trend broken, institutional selling confirmed, and macro headwinds intensifying due to tariff wars, the downside is very real. While the short-term bounce may offer hope, the broader trend remains clearly bearish unless a reversal pattern with volume emerges.
So how low can Ethereum go in April? If the $1,400 level doesn’t hold, $1,200–$1,000 becomes a real possibility—and fast.
Ethereum (ETH) , the world’s second-largest cryptocurrency, is caught in the crossfire of a global selloff triggered by tariff war tensions. With President Trump’s aggressive tariff measures shaking up global markets, crypto is once again proving it's not immune to macroeconomic chaos. As ETH plunges below critical levels, traders are scrambling to assess the damage and ask the all-important question: How low can Ethereum go this April?
A close analysis of Ethereum's daily and hourly charts offers insight into just how vulnerable the asset has become—and whether a reversal is even possible in the near term.
Ethereum Price Prediction: What Is the Daily Chart Signaling About Ethereum’s Trend?
ETH/USD Daily Chart- TradingView
Ethereum’s daily chart reveals a steep downtrend that’s accelerating. The Heikin Ashi candles are printing long-bodied red bars, with little to no upper wicks—clear signs of strong bearish momentum. ETH price closed the most recent session at around $1,547, down 8.13% in a single day. That move followed several consecutive losing days, confirming not just a correction but a deeper breakdown.
The asset has fallen well below all key moving averages. While the full MA ribbon data didn’t load, it’s evident from structure and price action that Ethereum is now trading below the 200-day SMA, which typically serves as a critical support level for long-term investors. Breaking that line is historically a red flag for extended bearish periods.
The Accumulation/Distribution Line (ADL) adds to the worry. It's in sharp decline, confirming that smart money isn’t stepping in to buy this dip. Without accumulation, it’s unlikely Ethereum can stage a meaningful reversal in the coming days.
Can the Hourly Chart Give Bulls Any Hope?
ETH/USD 1 Hr Chart- TradingView
On the hourly chart, Ethereum has shown a small bounce off the recent low near $1,411, rising back to $1,571 at the time of writing. While this may seem like a bullish reaction, the rebound came after an extended downward cascade and is still under all major moving averages—including the 20, 50, 100, and 200 SMAs. The 200 SMA at $1,794 is particularly distant, showing how stretched the price is to the downside.
Heikin Ashi candles on the hourly timeframe have turned green, but only recently and without strong upward momentum. The recent candle spike suggests a short squeeze or profit-taking rather than real trend reversal. The ADL here remains flat to declining, indicating no real accumulation even on short timeframes.
In short, the hourly chart offers a temporary pause in selling, not a reliable sign of bullish recovery.
Where Are the Key Support and Resistance Levels for Ethereum?
Ethereum’s next major support level is $1,400, which held up in the most recent drop. If this level breaks again under stronger selling pressure, the next targets lie near $1,320 and $1,200, zones that previously acted as demand during the 2022–2023 bear market.
On the upside, Ethereum must reclaim $1,685 (the 50 SMA on the hourly chart) to neutralize the short-term trend. But the real shift in momentum would only occur above $1,800, where the 200 SMA and key resistance converge. Without those levels being broken, rallies remain suspect and vulnerable to quick rejection.
What Are the Chart Indicators Telling Us?
Moving Averages: ETH price is trading below all major moving averages across both timeframes, with the downward-sloping nature of the SMAs reinforcing the bearish momentum. This alignment usually precedes further downside unless invalidated by volume-backed breakouts.
Heikin Ashi Candles: Daily candles are extremely bearish, and while hourly candles have shown a bounce, the lack of consistency and volume weakens any bullish interpretation. Bulls need to see smaller-bodied, higher low candles to confirm reversal, which haven’t formed yet.
ADL (Accumulation/Distribution Line): The ADL on both charts is trending down, which is among the most troubling signs. A falling ADL during price dips suggests that whales and institutions are exiting, not accumulating—bad news for bullish continuation.
Ethereum Price Prediction: How Low Could It Go in April?
If bearish momentum persists and $1,400 breaks, Ethereum price could retrace to $1,200 or even $1,000 in April, particularly if macro fears escalate and crypto sentiment weakens. This would mark a full capitulation move and potentially form a long-term bottom.
However, if ETH stabilizes above $1,500 and starts to reclaim $1,685–$1,700, a short-term relief rally to $1,800–$1,850 could be on the table. But without strong volume and a rising ADL, even such a rally would be vulnerable to rejection.
Is Ethereum Headed for a Deeper Collapse?
Ethereum is at a critical juncture . With its long-term trend broken, institutional selling confirmed, and macro headwinds intensifying due to tariff wars, the downside is very real. While the short-term bounce may offer hope, the broader trend remains clearly bearish unless a reversal pattern with volume emerges.
So how low can Ethereum go in April? If the $1,400 level doesn’t hold, $1,200–$1,000 becomes a real possibility—and fast.
Disclaimer: The content of this article solely reflects the author's opinion and does not represent the platform in any capacity. This article is not intended to serve as a reference for making investment decisions.
You may also like
Will the traditional Christmas rally still happen in the US stock market this year?
After a simultaneous technical and position-based recovery in the US stock market, Goldman Sachs, Morgan Stanley, and JPMorgan have successively signaled a year-end rebound. Extremely light positions, mean reversion of valuations, and seasonal support together create conditions for a short squeeze. However, global manufacturing import price inflation has annualized at around 24%, surpassing the pandemic peak, and the inflation bill will come due intensively in the first quarter of next year. Goldman Sachs warns that once the year-end rally materializes, it may exhaust future upside potential.

Anthropic IPO Roadshow: CEO Says "Doesn't Care About Market Conditions", Hopes to "Underpromise and Overdeliver"
As Anthropic gears up for its IPO, CEO Amodei remains deliberately low-key during the roadshow, emphasizing "under-promise and over-deliver," and appears calm regarding market volatility at the time of listing. In response to fluctuations in the AI sector and the Nvidia situation, Amodei stated he is not particularly concerned about the specific month of listing or market conditions, and frankly admits that allocation of computing power is "the most fundamental business challenge."
SpaceX (SPCX.US) Starship's 15th Test Flight: Booster recovery failed for unknown reasons; first orbital round-trip mission still awaits upper stage "tower catch" landing
On Friday local time, SpaceX conducted its 15th Starship flight mission in Texas.

Unlike Elon Musk’s “One Price” Approach: Anthropic (ANT.US) Roadshow Pricing Inquiry at $70-78, Institutional Investors Become the True Decision Makers in IPO Pricing
Anthropic will launch what is set to be the largest IPO in history next week, aiming to take this title from SpaceX. However, unlike Elon Musk’s conglomerate, large investors will have greater influence over its IPO pricing amid the ongoing turbulence in the artificial intelligence (AI) market.
Crypto prices
More


