
Dogecoin (DOGE) Down 12% In One Week as Indicators Show Potential Recovery

Dogecoin remains under bearish control, but early technical signs suggest momentum may be shifting as traders eye critical resistance levels.
Dogecoin (DOGE) continues to face significant selling pressure, with the popular meme coin shedding more than 12% of its value over the past seven days.
Technical indicators paint a complex picture as the Ichimoku Cloud shows early signs of a potential momentum shift despite bearish EMA alignments. The BBTrend indicator’s recovery from extreme negative values suggests the downward move may be approaching exhaustion even as price action remains vulnerable.
Dogecoin Ichimoku Cloud Shows A Potential Shift In Momentum
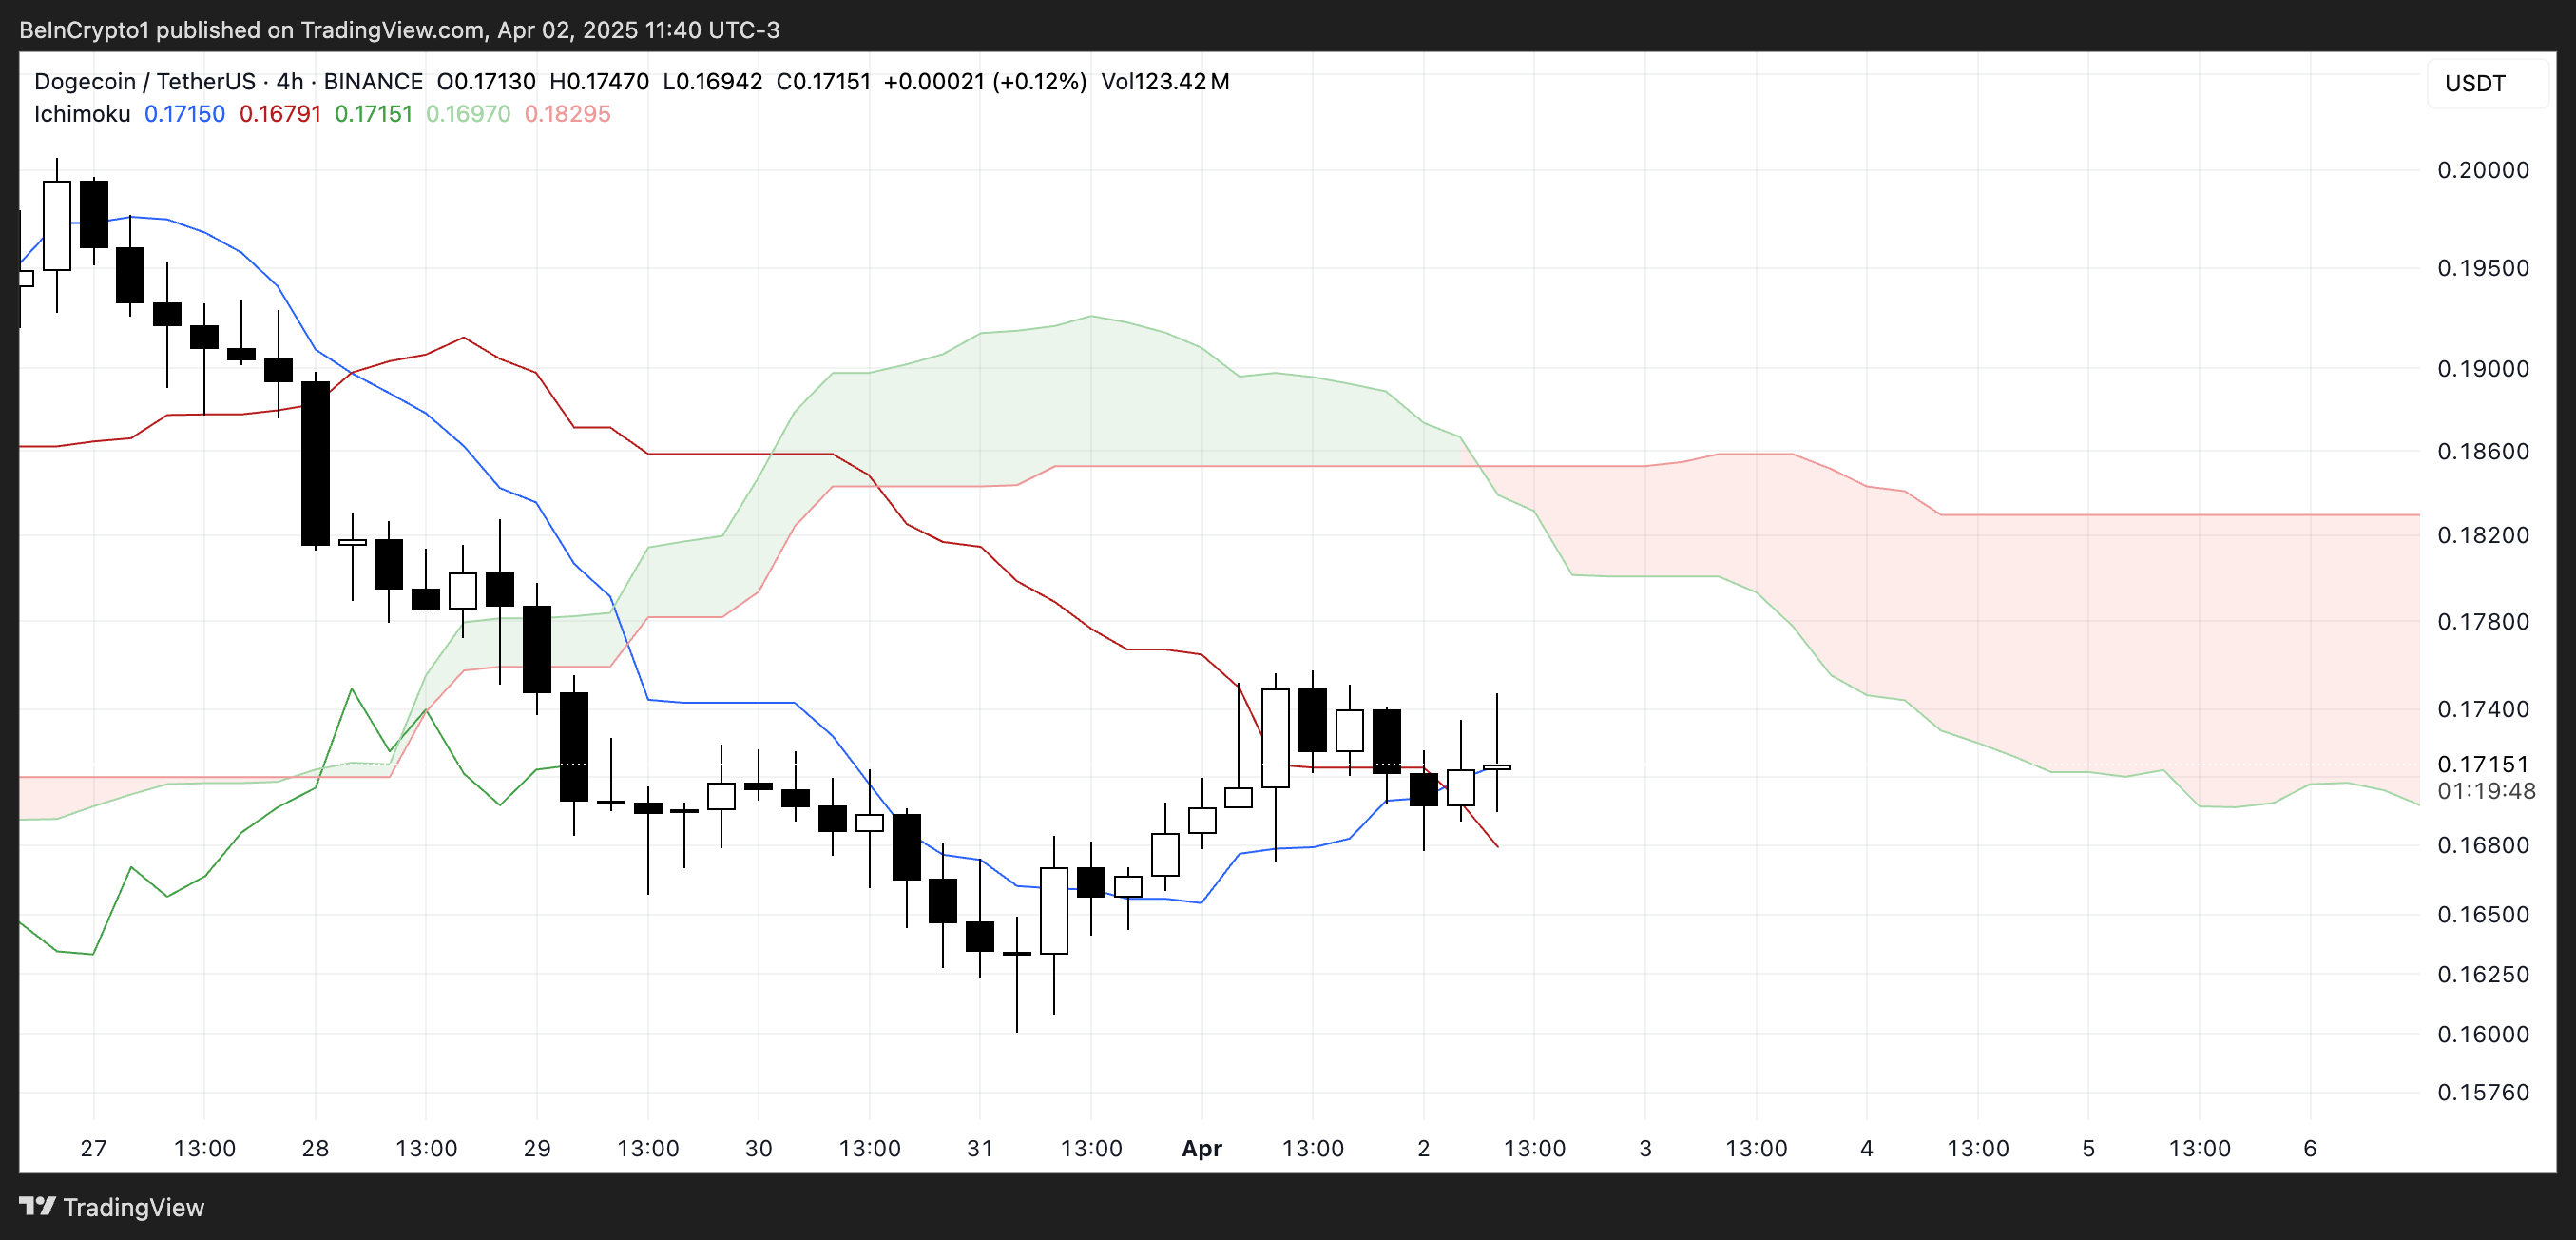
The Dogecoin chart displays an Ichimoku Cloud setup that reflects recent volatility and shifting momentum.
The price action initially shows a pronounced downtrend from late March, as indicated by the price bars trading well below the cloud. The blue line (Conversion Line) crosses below the red line (Base Line), signaling bearish momentum.
The cloud itself transitions from thick to thin before appearing to shift color, indicating a changing market structure.
 DOGE Ichimoku Cloud. Source:
TradingView.
More recently, there appears to be a potential reversal forming as the price action begins testing the lower boundary of the cloud while the Conversion Line has started curving upward toward the Base Line.
This suggests increasing buying pressure, though the price remains in a contested zone. The green line (Leading Span A) and red shaded areas show that market sentiment remains cautious, with the cloud formation ahead suggesting continued uncertainty in the immediate future.
Traders might watch for the blue line to cross above the red line and for price to penetrate and maintain position above the cloud as potential confirmation of a more sustainable bullish shift.
DOGE BBTrend Is Still Very Negative, But Recovering
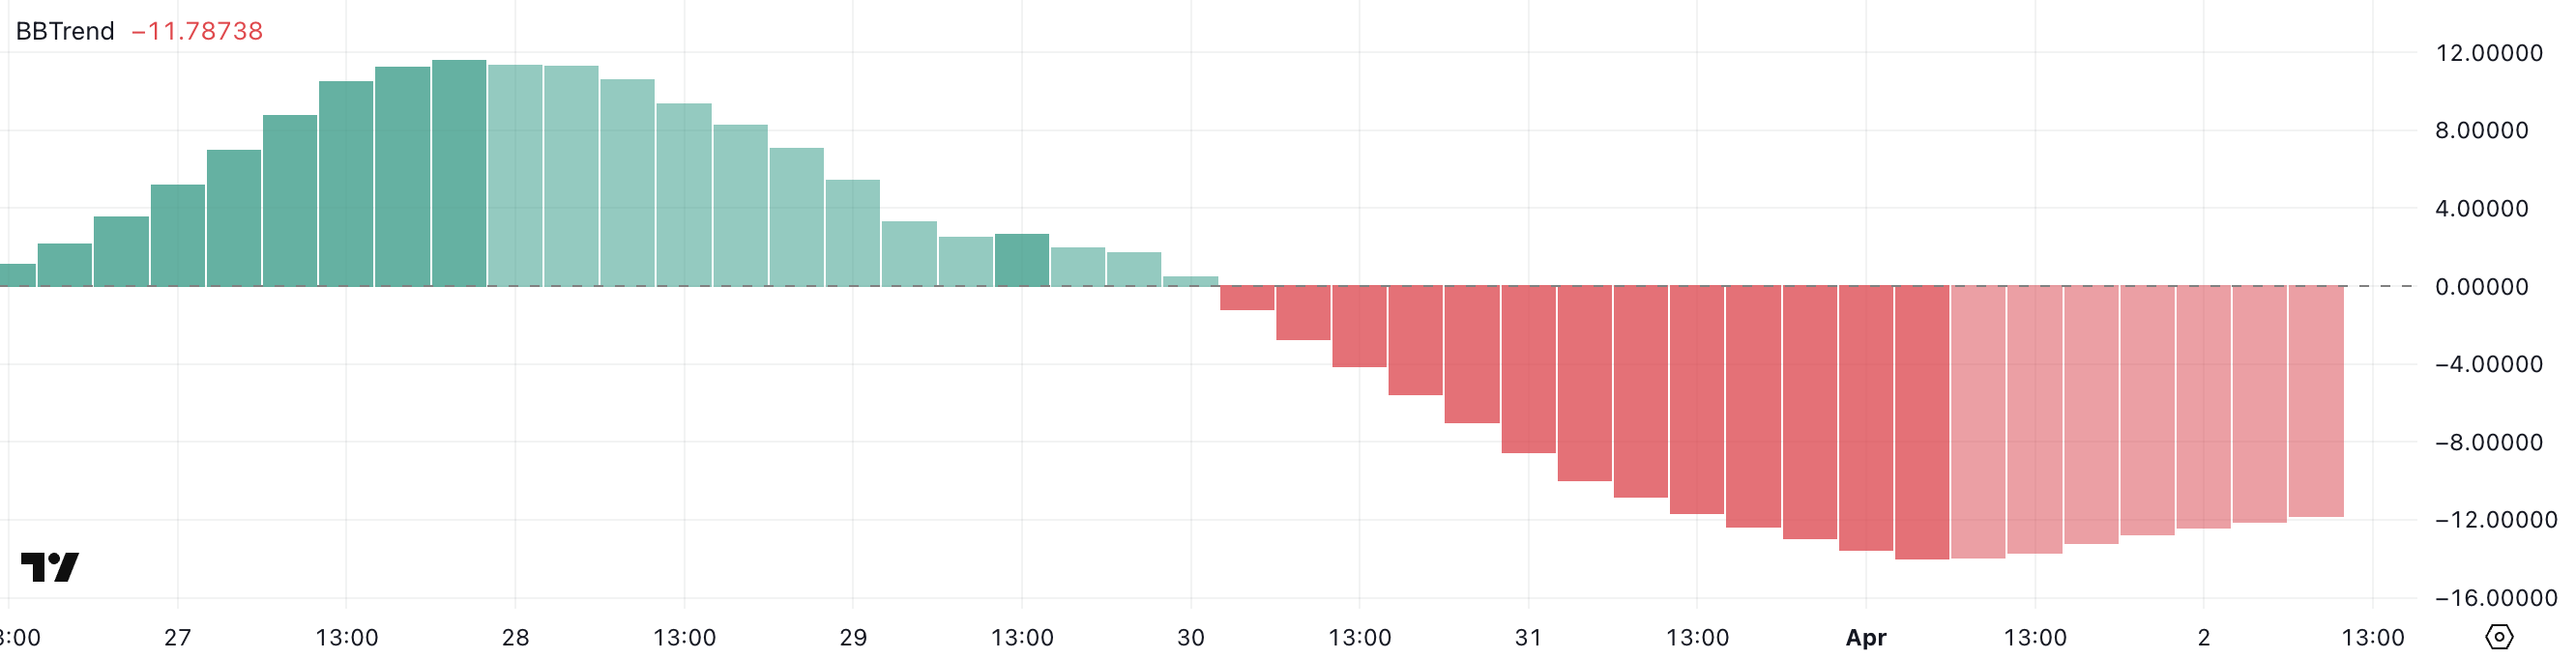
The BBTrend indicator for Dogecoin currently sits at -11.78, improving from yesterday’s more extreme reading of -13.96 yet remaining firmly bearish.
This three-day negative streak with slight recovery suggests selling pressure may be easing, though the market maintains its downward bias as readings below -10 typically indicate strong bearish momentum.
 DOGE BBTrend. Source:
TradingView.
With the indicator still below the significant -10 threshold but moving upward, Dogecoin likely faces continued downward pressure while potentially approaching oversold conditions.
This combination suggests DOGE might soon enter a technical bounce or consolidation phase, though traders would need to see the BBTrend rise decisively toward the neutral zone before considering the current bearish trend exhausted.
Will Dogecoin Rise To $0.20 Next?
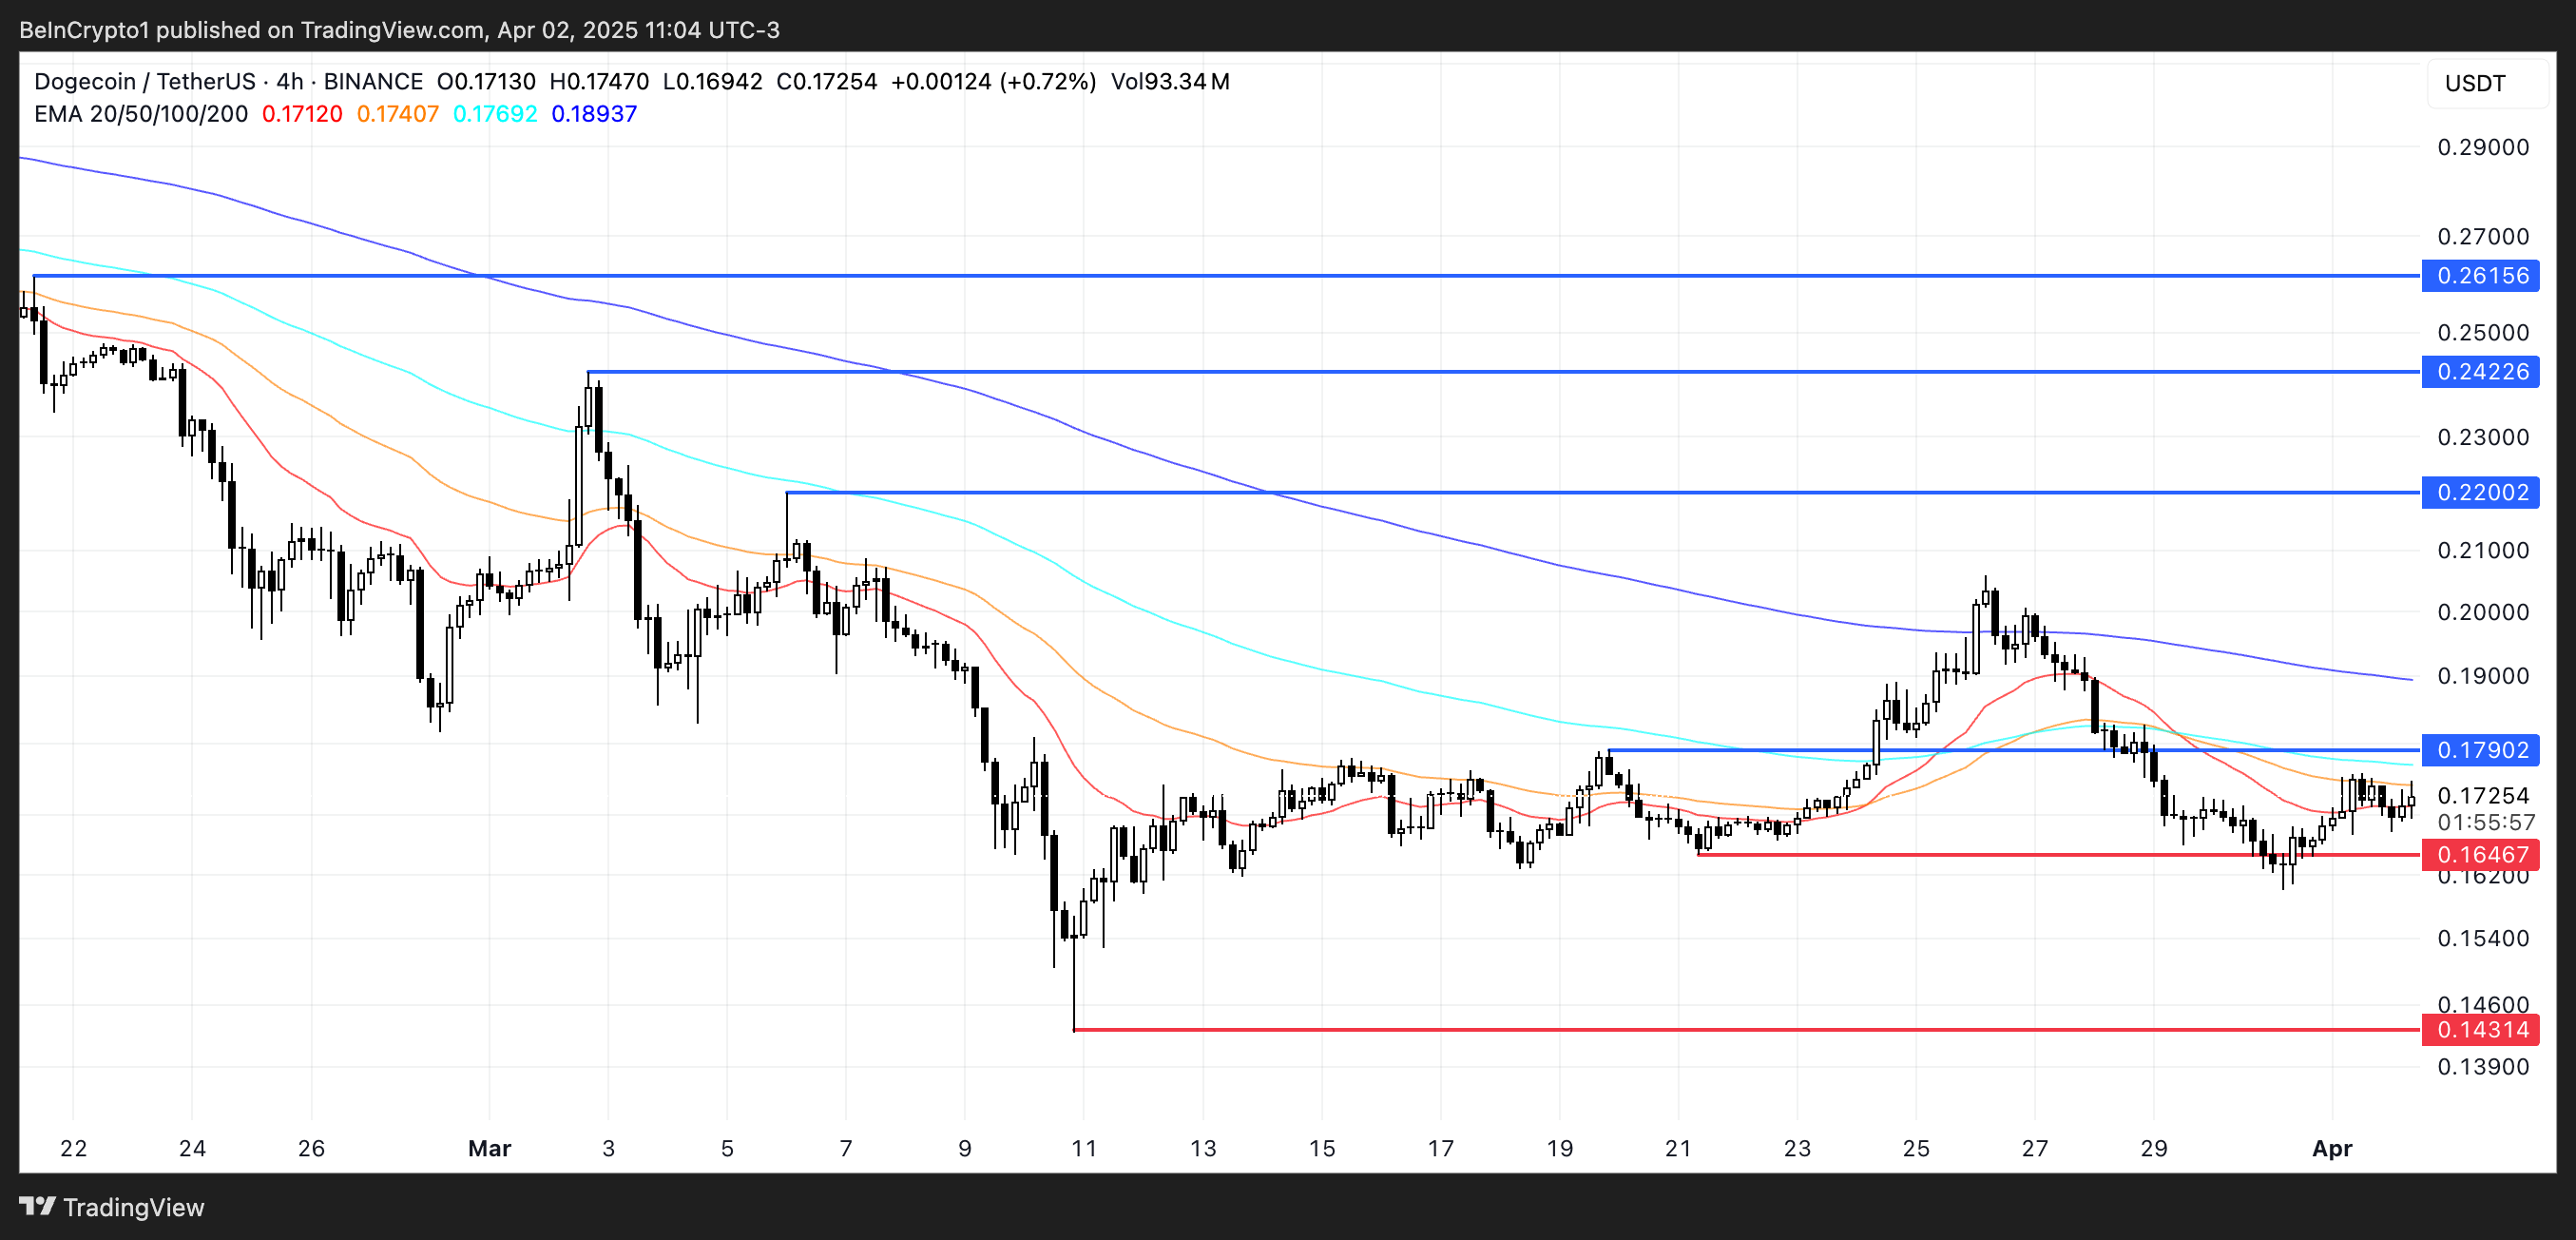
Dogecoin’s EMA configuration remains bearish, with short-term exponential moving averages positioned below their long-term counterparts, indicating sustained downward momentum.
However, if this trend reverses and the shorter EMAs cross above the longer ones, Dogecoin price could challenge immediate resistance at $0.179, potentially opening pathways to higher targets should this level be breached.
 DOGE Price Analysis. Source:
TradingView.
Conversely, if bearish pressure persists, Dogecoin risks retesting the critical support level at $0.16, which has previously held firm.
A breakdown below this support would be technically significant and could accelerate selling pressure, potentially driving DOGE toward deeper support at $0.14, representing a substantial decline from current levels.
Disclaimer: The content of this article solely reflects the author's opinion and does not represent the platform in any capacity. This article is not intended to serve as a reference for making investment decisions.
You may also like
AI trading retreats and corporate profit growth boost European stocks! Four-day winning streak halted but still on track for biggest weekly gain since July
European stock markets had previously risen for four consecutive trading days and reached record highs, but this rally could not be sustained. The Stoxx Europe 600 Index has climbed 2.2% this week and is on track for its largest weekly gain since July.
Nebius (NBIS.US) Q3 Conference Call: CEO Says AI “Demand Is Real and Huge”, Expects Pre-tax Break-even by Q4 2027
Nebius Group (NBIS.US) will release its Q3 2026 financial results before the market opens on November 12 (US Eastern Time) and hold a conference call on the same day.
Jensen Huang's resignation drags down AI trading, US three major stock index futures collectively fall, Nvidia stabilizes pre-market, Brent crude rebounds and breaks through $96
Nasdaq 100 index futures fell over 0.3%, and S&P 500 index futures declined 0.14%. Brent crude oil rose 0.37% to $96 per barrel. Spot gold increased 0.4% to $3,893.48 per ounce. Investors are now focusing on the US PPI data to be released tonight.
Invesco's Q3 Holdings Shuffle: Reduced Nvidia (NVDA.US) and Semiconductor Equipment Positions, SpaceX (SPCX.US) Holdings Surge to Over $10 Billion
Invesco has submitted its Q3 holdings report (13F) for the period ending September 30, 2026.
Crypto prices
More


