Bitget App
Trade smarter
Buy cryptoMarketsTradeFuturesStocksEarnInstitutionAI & More
WLD and CRV Approach Key Resistance – Are Major Breakouts on the Horizon?

WLD and CRV Approach Key Resistance – Are Major Breakouts on the Horizon?

CoinsProbeCoinsProbe2025/03/26 14:59
By:Nilesh Hembade

Date: Wed, March 26, 2025 | 07:05 AM GMT

The cryptocurrency market is showing strong signs of a rebound, with Bitcoin (BTC) and Ethereum (ETH) gaining 5.50% and 6.50% over the past seven days—a promising shift after a rather choppy start to March. As overall sentiment slowly begins to shift in a more positive direction, altcoins like Worldcoin (WLD) and Curve DAO Token (CRV) are starting to show upside momentum.
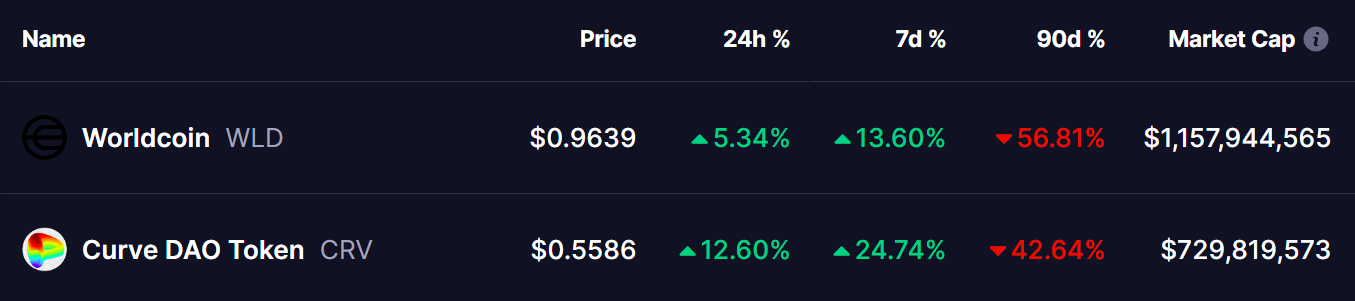
WLD and CRV Approach Key Resistance – Are Major Breakouts on the Horizon? image 0 Source: Coinmarketcap

Both tokens had been under heavy pressure over the past few months, but their current weekly gains and technical setups hint at a potential recovery brewing on the horizon.

Worldcoin (WLD) Analysis

WLD’s daily chart reveals a falling wedge pattern—a classic bullish reversal setup that has been forming for almost a year. The recent correction, which began in early December from the high of $4.18, dragged WLD down over 85%, bottoming out at $0.72 on March 11. This level saw buyers step in to defend key support, signaling a possible trend reversal.
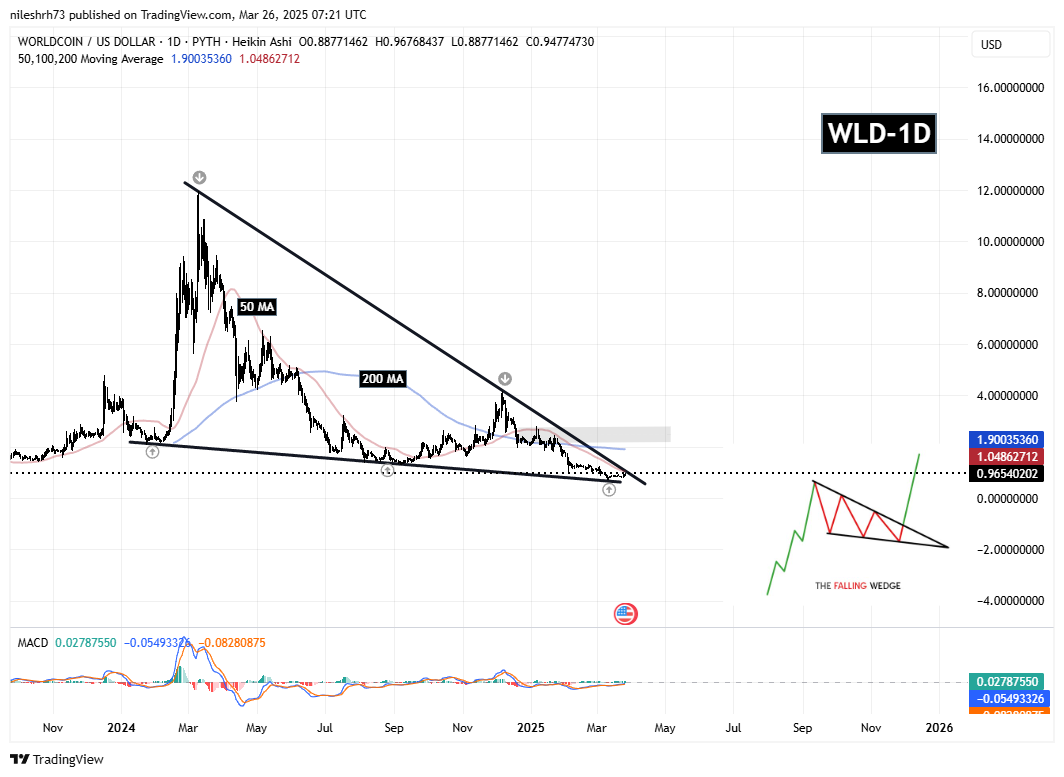
WLD and CRV Approach Key Resistance – Are Major Breakouts on the Horizon? image 1 Worldcoin (WLD) Daily Chart/Coinsprobe (Source: Tradingview)

Since then, WLD has rebounded to above of $0.96 and is now approaching the upper boundary of the wedge, as well as the 50-day moving average (MA). If the price breaks out and holds above this resistance with a successful retest, WLD could aim for the 200-day moving average and the $2.80 zone—representing a potential 168% rally from current levels.

The MACD indicator is also showing signs of a bullish crossover, reinforcing the likelihood of a breakout. However, failure to breach resistance could see WLD re-test lower support levels before attempting another move upwards.

Curve DAO Token (CRV) Analysis

On the other hand, Curve DAO Token (CRV) is consolidating within a classic bullish flag pattern. This formation took shape after the token was rejected at the $1.33 resistance level on December 7, leading to a sharp correction. The decline brought CRV down to a low of $0.35 on March 11, where strong buying interest emerged.
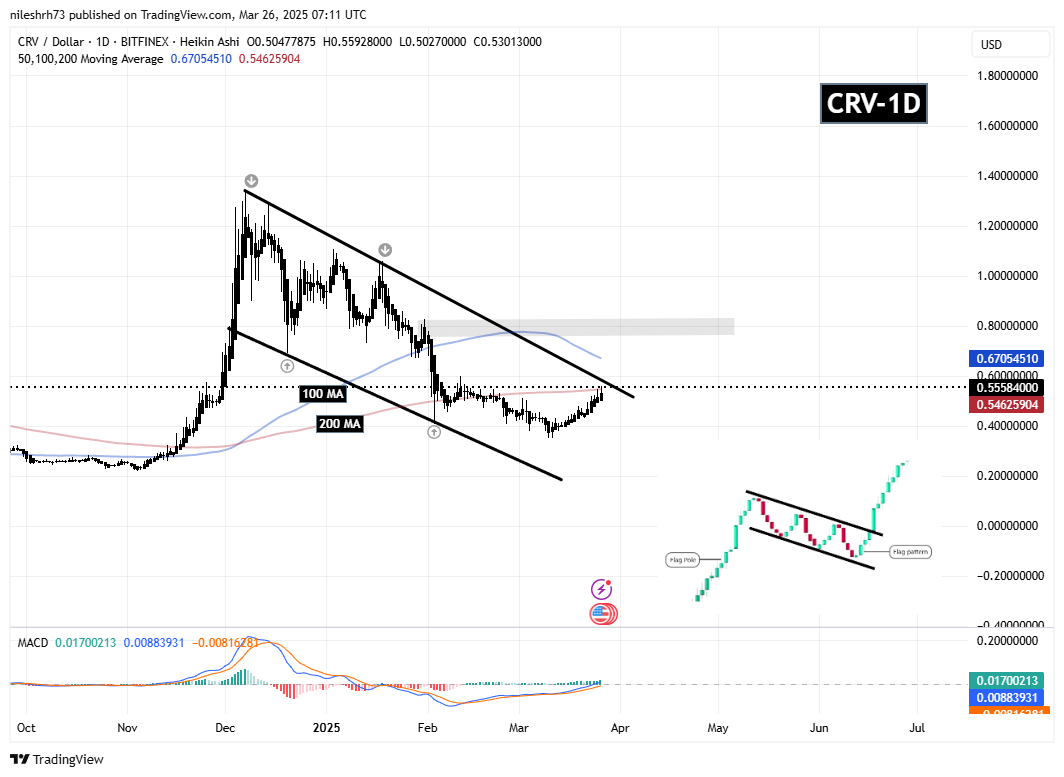
WLD and CRV Approach Key Resistance – Are Major Breakouts on the Horizon? image 2 CRV Token Daily Chart/Coinsprobe (Source: Tradingview)

Currently, CRV has recovered to $0.55, testing its 200-day MA, and is edging closer to the upper resistance of the flag. A breakout from this formation, followed by a confirmation retest, could pave the way for a move toward the 100-day MA and the $0.8274 resistance zone, representing a potential 49% upside from current price levels.

The MACD is also turning positive, adding further confluence to the bullish outlook.

What’s Ahead?

As WLD and CRV approach their respective breakout levels, all eyes are on Bitcoin and Ethereum for confirmation of broader market strength. A sustained bullish trend in major cryptocurrencies could provide the necessary momentum for altcoins to break out from their technical patterns.

Traders and investors should keep a close watch on key resistance levels, volume confirmations, and macroeconomic factors that could influence market sentiment in the coming weeks.

Disclaimer: This article is for informational purposes only and not financial advice. Always conduct your own research before investing in cryptocurrencies.


0
0

Disclaimer: The content of this article solely reflects the author's opinion and does not represent the platform in any capacity. This article is not intended to serve as a reference for making investment decisions.

Understand the market, then trade.
Bitget offers one-stop trading for cryptocurrencies, stocks, and gold.
Trade now!

You may also like

Anthropic (ANT.US) nearly “broke issue price,” but Claude knocks on the doors of “the highest peak in mathematics”! 17 million lines of Lean code used to write a candidate proof for the Riemann Hypothesis

On November 20th, Eastern Time, on its second day of trading, Anthropic's intraday price dropped to a low of $83.05, just 5 cents above the offering price of $83, and finally closed at $88.91, a decline of 8.50%. On the same day, the company's mathematician Levant Alperg announced on his personal website that he and Claude had found a candidate proof for the Riemann hypothesis, which has puzzled the mathematics community for 167 years, and released about 17 million lines of Lean formalized code.

智通财经•2026/11/21 03:21
Anthropic (ANT.US) nearly “broke issue price,” but Claude knocks on the doors of “the highest peak in mathematics”! 17 million lines of Lean code used to write a candidate proof for the Riemann Hypothesis

As US stocks plummet, the parent company of GTA 6 rises against the market! First-day sales hit a record $3.79 billion; Wall Street shifts focus to next-generation GTA Online.

According to Rentrak data, the global box office of "Grand Theft Auto VI" has also surpassed that of "Avengers: Endgame," the highest-grossing film of all time, which has a global box office of approximately $2.94 billion.

智通财经•2026/11/21 02:41
As US stocks plummet, the parent company of GTA 6 rises against the market! First-day sales hit a record $3.79 billion; Wall Street shifts focus to next-generation GTA Online.

$2.3 trillion “vanished into thin air”! The last time US chip stocks fell this badly was in 2001, Nvidia has already “lost an Amazon’s worth”.

This week, the Philadelphia Semiconductor Index dropped by over 10%, wiping out approximately $2.3 trillion in market capitalization from the chip sector, marking its worst single-week performance since 2001. Nvidia’s stock price has fallen for seven consecutive weeks, shrinking its market value by about $2.7 trillion since its October peak. Tightened financing support from Nvidia and the Anthropic IPO siphoning off liquidity, combined with continued hawkish signals from the Federal Reserve, have added further pressure. AI-related trades have faced concentrated sell-offs, and market concerns about future growth prospects are intensifying.

华尔街见闻•2026/11/21 02:36
$2.3 trillion “vanished into thin air”! The last time US chip stocks fell this badly was in 2001, Nvidia has already “lost an Amazon’s worth”.

Nasdaq evaporated over $4 trillion in a week! After the global stock market's "Black Friday," the market begins to anticipate an AI industry chain rebound after excessive declines.

The S&P 500 Index plunged by 3.70% on Friday to 6,910.39 points, falling for the seventh consecutive trading day. Alongside the Dow Jones Industrial Average, which dropped 1.93%, both indices pulled back more than 10% from their historic closing highs, confirming entry into a technical correction. The Nasdaq Composite Index fell 5.28%, erasing its gains for the year. The Nasdaq 100 Index dropped 5.61%, falling about 19.84% from its historic closing high on October 6. At one point during the session, the decline exceeded 20%, entering what is referred to as a "technical bear market area."

智通财经•2026/11/21 02:01