Bitget App
Trade smarter
Buy cryptoMarketsTradeFuturesStocksEarnInstitutionAI & More
Is Ethereum’s (ETH) Triangle Formation Pointing to a Major Breakout Similar to XRP’s Recent Surge?

Is Ethereum’s (ETH) Triangle Formation Pointing to a Major Breakout Similar to XRP’s Recent Surge?

CoinsProbeCoinsProbe2025/01/27 20:44
By:Nilesh Hembade

Date: Mon, Jan 27, 2025, 04:11 AM GMT

The cryptocurrency market continues to face turbulence, with a 5% decline in Ethereum (ETH) and XRP (XRP) prices over the last 24 hours, reflecting broader market volatility. This comes amidst global market downturns and speculation around China’s newly launched Deep Seek AI Model, raising concerns about US tech dominance.
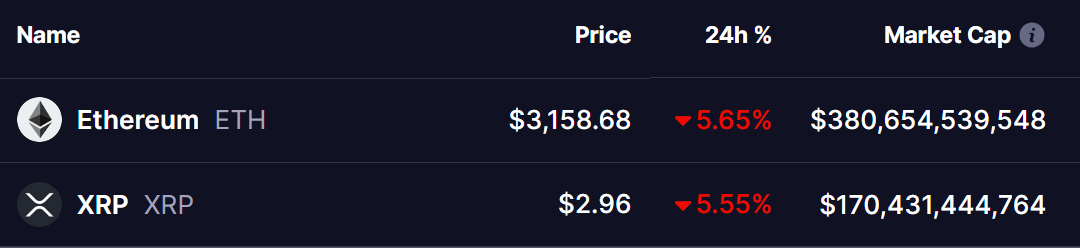
Is Ethereum’s (ETH) Triangle Formation Pointing to a Major Breakout Similar to XRP’s Recent Surge? image 0 Source: Coinmarketcap

However, in the midst of this uncertainty, Ethereum’s price action is drawing significant attention, with some analysts pointing to a potentially bullish setup.

Ethereum (ETH) and XRP Chart Analysis

Crypto trader @Guardian1771_ recently shared insights indicating Ethereum may be following a path similar to XRP’s recent breakout.

Is Ethereum’s (ETH) Triangle Formation Pointing to a Major Breakout Similar to XRP’s Recent Surge? image 1 XRP-ETH CHART/Source: @Guardian1771_ (X)

In November 2024, XRP shattered a 7-year symmetrical triangle pattern, rallying 480% within 75 days. XRP’s price surged from $0.58 to $3.29, while its market capitalization skyrocketed from $30 billion to $195 billion during this period. This breakout demonstrated the immense potential of long-term technical patterns.

Ethereum, too, appears to be forming a symmetrical triangle, consolidating in a setup that could lead to a significant move. Analysts note that this pattern often indicates a balance of buying and selling pressure, which could resolve with a sharp price movement in either direction.

Ethereum’s Weekly Chart: Key Insights

Ethereum’s current trading level of $3,150 shows it navigating a falling wedge pattern within the larger symmetrical triangle. This wedge is marked by converging trendlines, which are pivotal for determining ETH’s next move.

Is Ethereum’s (ETH) Triangle Formation Pointing to a Major Breakout Similar to XRP’s Recent Surge? image 2 Ethereum (ETH) W Chart/Coinsprobe (Source: Tradingview)

Key Technical Levels:

  • Support Levels:
    • The 50-day Simple Moving Average (SMA) is acting as immediate support.
    • The 100-day SMA aligns with the ascending support of the triangle, providing additional stability.
  • Resistance Levels:
    • The falling wedge’s upper boundary presents the first hurdle for ETH.
    • If ETH breaks out of this wedge, it could approach the triangle’s descending resistance, which marks a critical area for bullish confirmation.

A breakout beyond the falling wedge and subsequent move toward the descending triangle resistance would signal a potential shift in momentum. Should ETH clear this resistance, a rally similar to XRP’s November surge could be in play.

Final Thoughts

While Ethereum has struggled to generate upside momentum recently, its symmetrical triangle and falling wedge formations suggest a promising long-term outlook. A successful breakout from the wedge could set ETH on a path toward testing and potentially surpassing the triangle’s descending resistance, paving the way for significant price gains.

Advertisement
Your browser does not support the video tag.

However, traders should remain cautious. Confirmation of the breakout, accompanied by volume and sustained price action, is critical before making any investment decisions. As always, consider the inherent risks in the cryptocurrency market and conduct thorough research.

Disclaimer: This article is for informational purposes only and does not constitute financial advice. Always consult with a financial advisor before making any investment decisions.


0
1

Disclaimer: The content of this article solely reflects the author's opinion and does not represent the platform in any capacity. This article is not intended to serve as a reference for making investment decisions.

Understand the market, then trade.
Bitget offers one-stop trading for cryptocurrencies, stocks, and gold.
Trade now!

You may also like

How much CPO demand will Nvidia Rubin Ultra generate? Bernstein: Optical value per Pod will increase fivefold

Bernstein believes that the co-packaged optics (CPO) and fiber demand driven by Nvidia's Rubin Ultra architecture will surge significantly, with the optical content per Pod rising from $1 million to $5.4 million. This will propel the size of Nvidia's optical ecosystem market to $46.8 billion by 2028 (a 91% annual increase). Although the industry faces supply bottlenecks with InP substrates, the outlook remains positive. The institution reiterates its “outperform” rating for Lumentum, Coherent, and Ciena.

华尔街见闻•2026/11/11 08:47
How much CPO demand will Nvidia Rubin Ultra generate? Bernstein: Optical value per Pod will increase fivefold

UBS Q3 implements a two-way strategy with gold options, heavily invests in technology stocks, and builds positions in SK Hynix (SKHY.US)

UBS Group (UBS.US) has submitted its Q3 holdings report (13F) as of September 30, 2026.

智通财经•2026/11/11 08:22
UBS Q3 implements a two-way strategy with gold options, heavily invests in technology stocks, and builds positions in SK Hynix (SKHY.US)

SpaceX (SPCX.US) reportedly attempts “de-Nvidiaization” at the rack level: developing Kessel cabinets to bypass L6 compute boards, purchasing only chips

SemiAnalysis: SpaceX has developed its own Kessel cabinet, bypassing Nvidia's L6 cards to provide more options for manufacturing its own hardware.

智通财经•2026/11/11 08:20
SpaceX (SPCX.US) reportedly attempts “de-Nvidiaization” at the rack level: developing Kessel cabinets to bypass L6 compute boards, purchasing only chips

$3.7 billion “data center power equipment prepayments” abandoned! What did "the most active buyer of gas turbines", SoftBank, see?

In the second quarter of fiscal year 2026, SoftBank reported a net loss of $7.1 billion, primarily due to a $3.7 billion impairment charge from a $9.5 billion advance payment for power generation equipment for US data centers—of which about $2.9 billion was non-refundable and effectively lost. The CFO admitted that SoftBank placed orders before the project plan was finalized, and is now conducting a comprehensive review of its procurement strategy. "The most aggressive purchaser of gas turbines has now written off the deposit in this way."

华尔街见闻•2026/11/11 08:19
