
Dogecoin vs Bitcoin: Bull Flag Suggests DOGE $1 Rally Imminent

Dogecoin (DOGE) breaks out on the DOGE/BTC chart, signaling bullish momentum. With buying pressure rising, can it reach the $1 milestone?
The Dogecoin (DOGE) vs Bitcoin (BTC) chart has shown an intriguing signal on the monthly timeframe, indicating that the meme coin may be ready for a price increase. Historical analysis reveals a consistent pattern: whenever Bitcoin’s price drops relative to DOGE, the latter tends to rise, reaching new highs.
At press time, Dogecoin’s price is $0.44 and is 40% away from reaching its all-time high. However, with the current outlook, the cryptocurrency could be set to surpass that level.
Dogecoin Stays Strong Against the Number One Coin
A look at the DOGE/BTC chart shows the formation of a bull flag. A bull flag is a classic continuation pattern in an uptrend, characterized by a brief period of downward consolidation followed by a sharp price surge.
On a chart, the bullish flag often takes the shape of a narrowing triangle or rectangle (flag), reflecting declining trading volumes as market participants secure their positions. Once the range tightens, a breakout — known as a bullish pennant — typically occurs, propelling the price upward and confirming the continuation of the uptrend.
As seen above, the Dogecoin vs Bitcoin chart shows that the meme coin has broken out of the consolidation period, with the pair now worth 0.0000042. Should the trend remain at zero, the DOGE/BTC pair might erase oen zero and climb toward 0.000014.
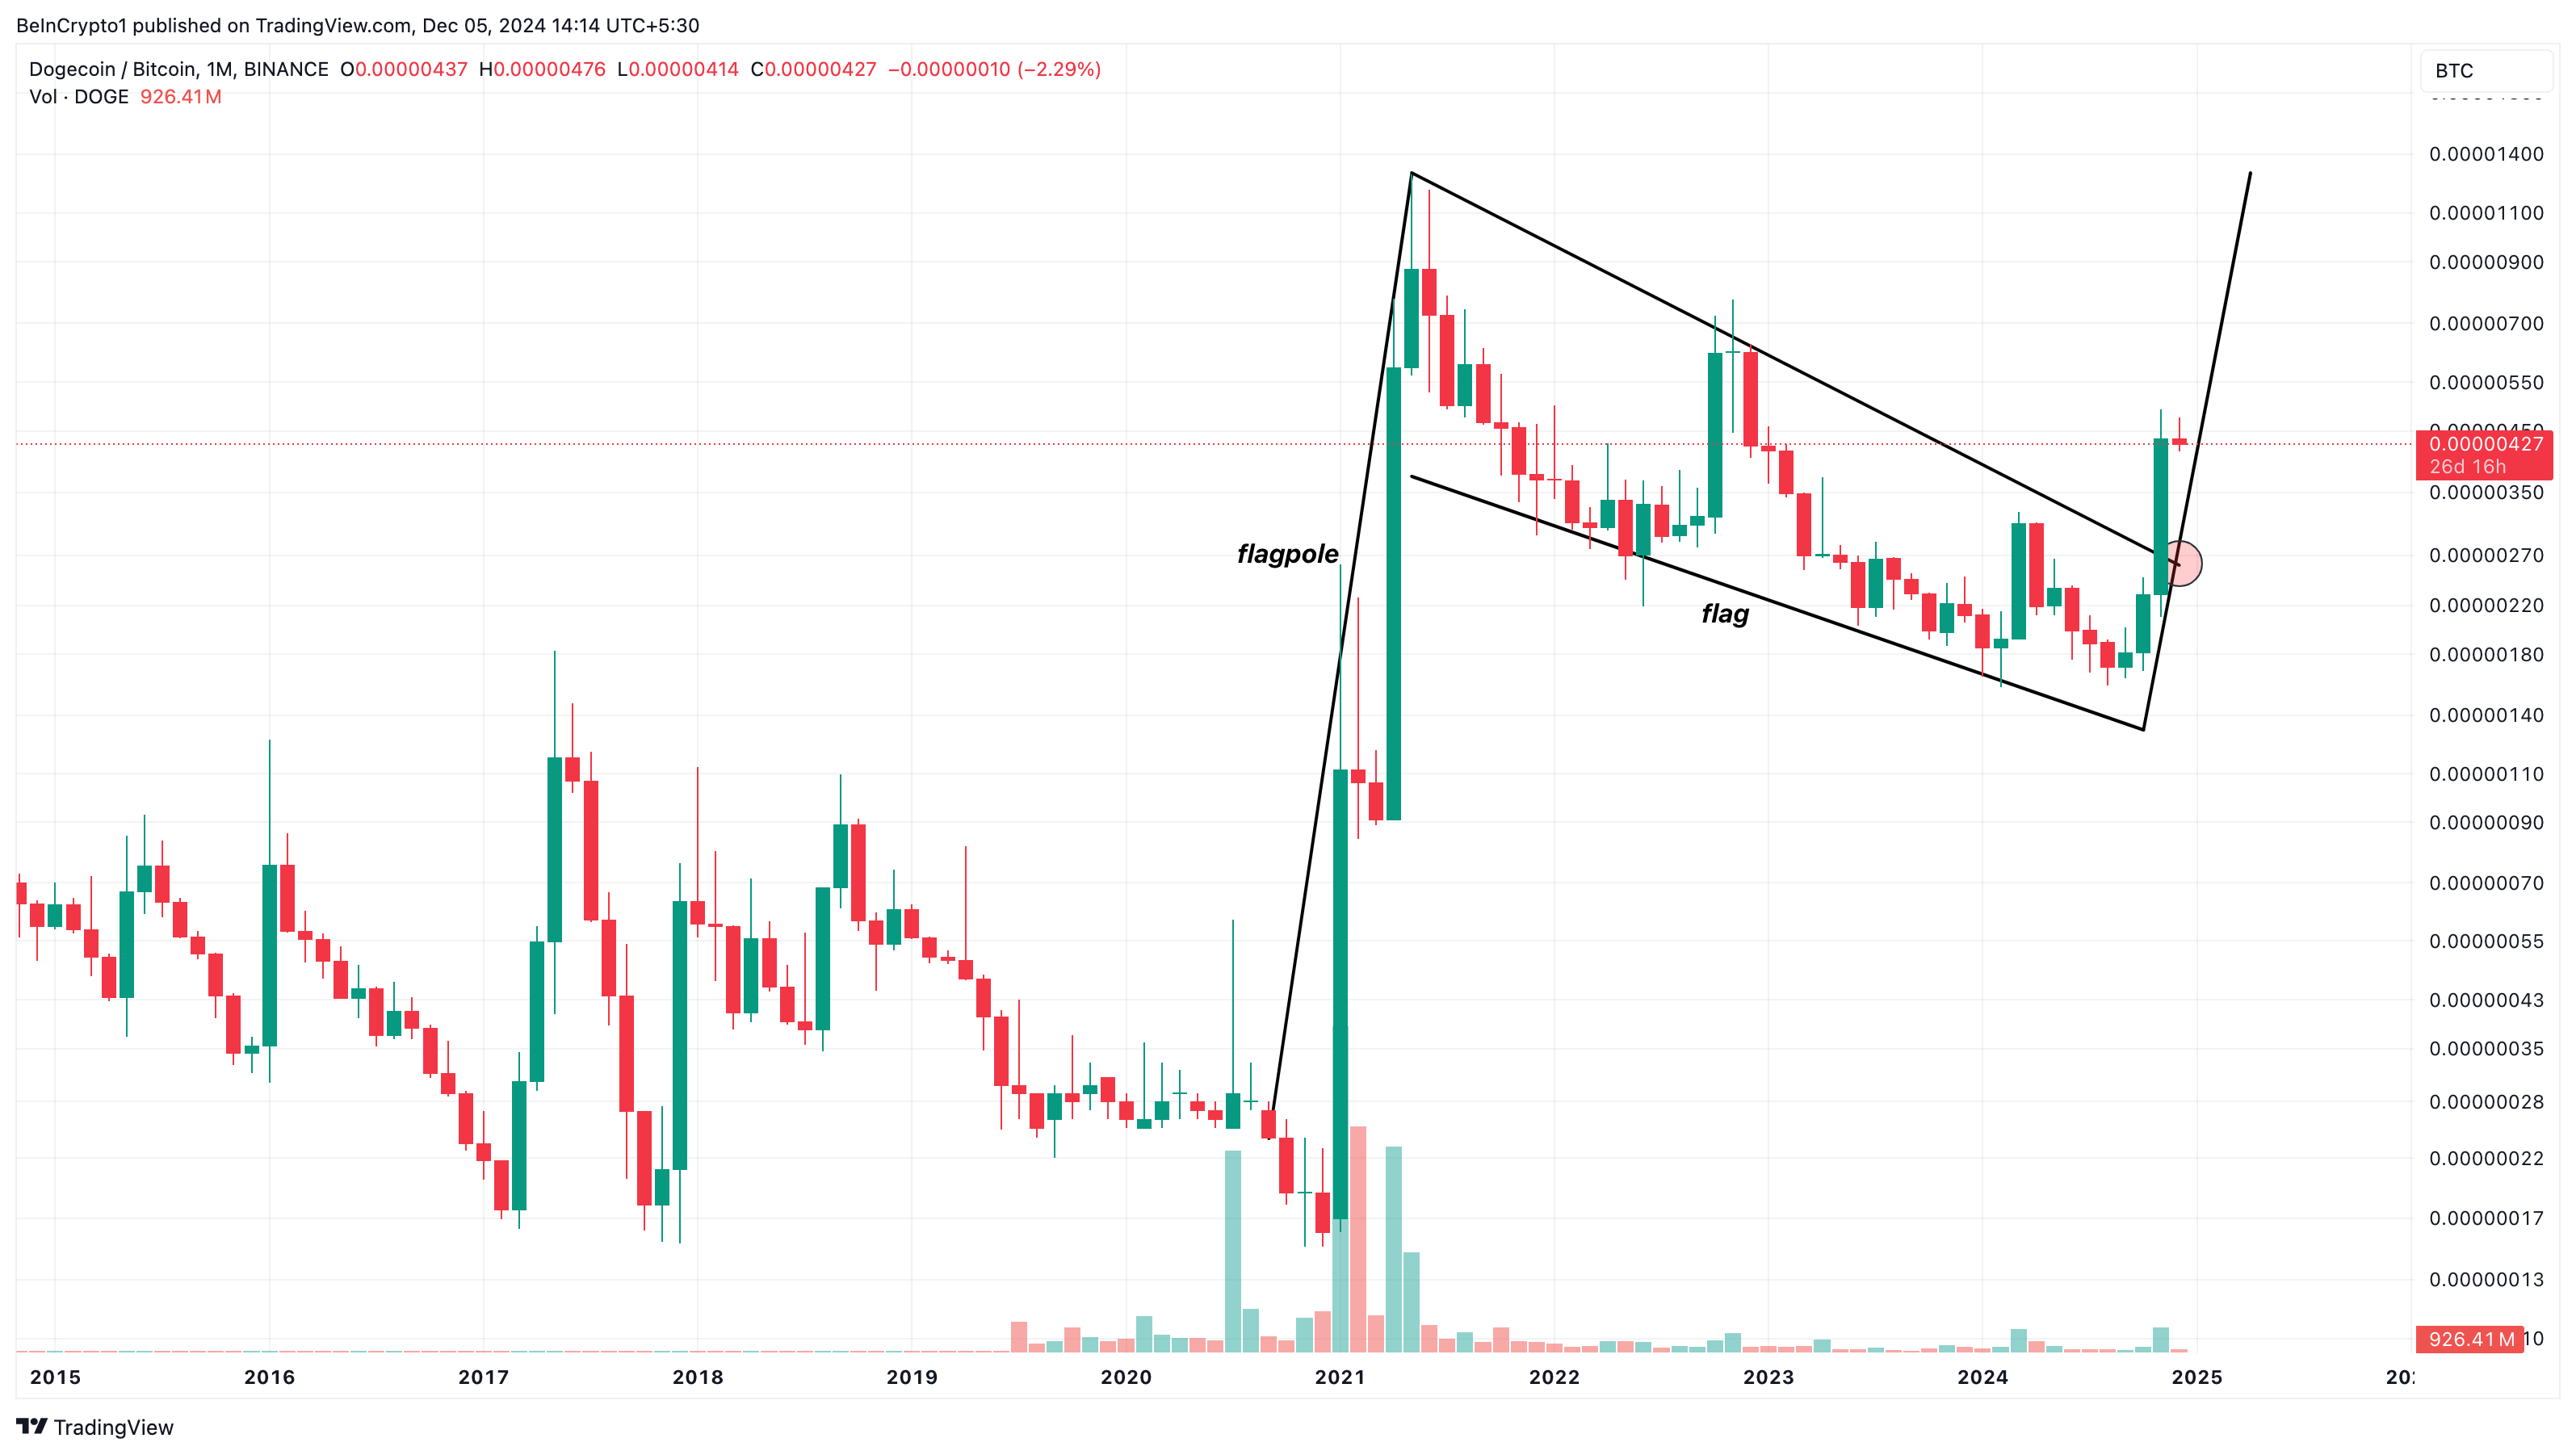 Dogecoin/Bitcoin Monthy Analysis. Source:
TradingView
Further, the 4-hour DOGE/USD chart reinforces the bullish outlook, with the Money Flow Index (MFI) climbing to 70.70. The MFI gauges the inflow of capital into a cryptocurrency, offering insights into market momentum.
A rising MFI signifies increased buying pressure, while a decline indicates selling dominance. Dogecoin’s rising MFI suggests growing demand, potentially fueling its prediction toward the $1 milestone.
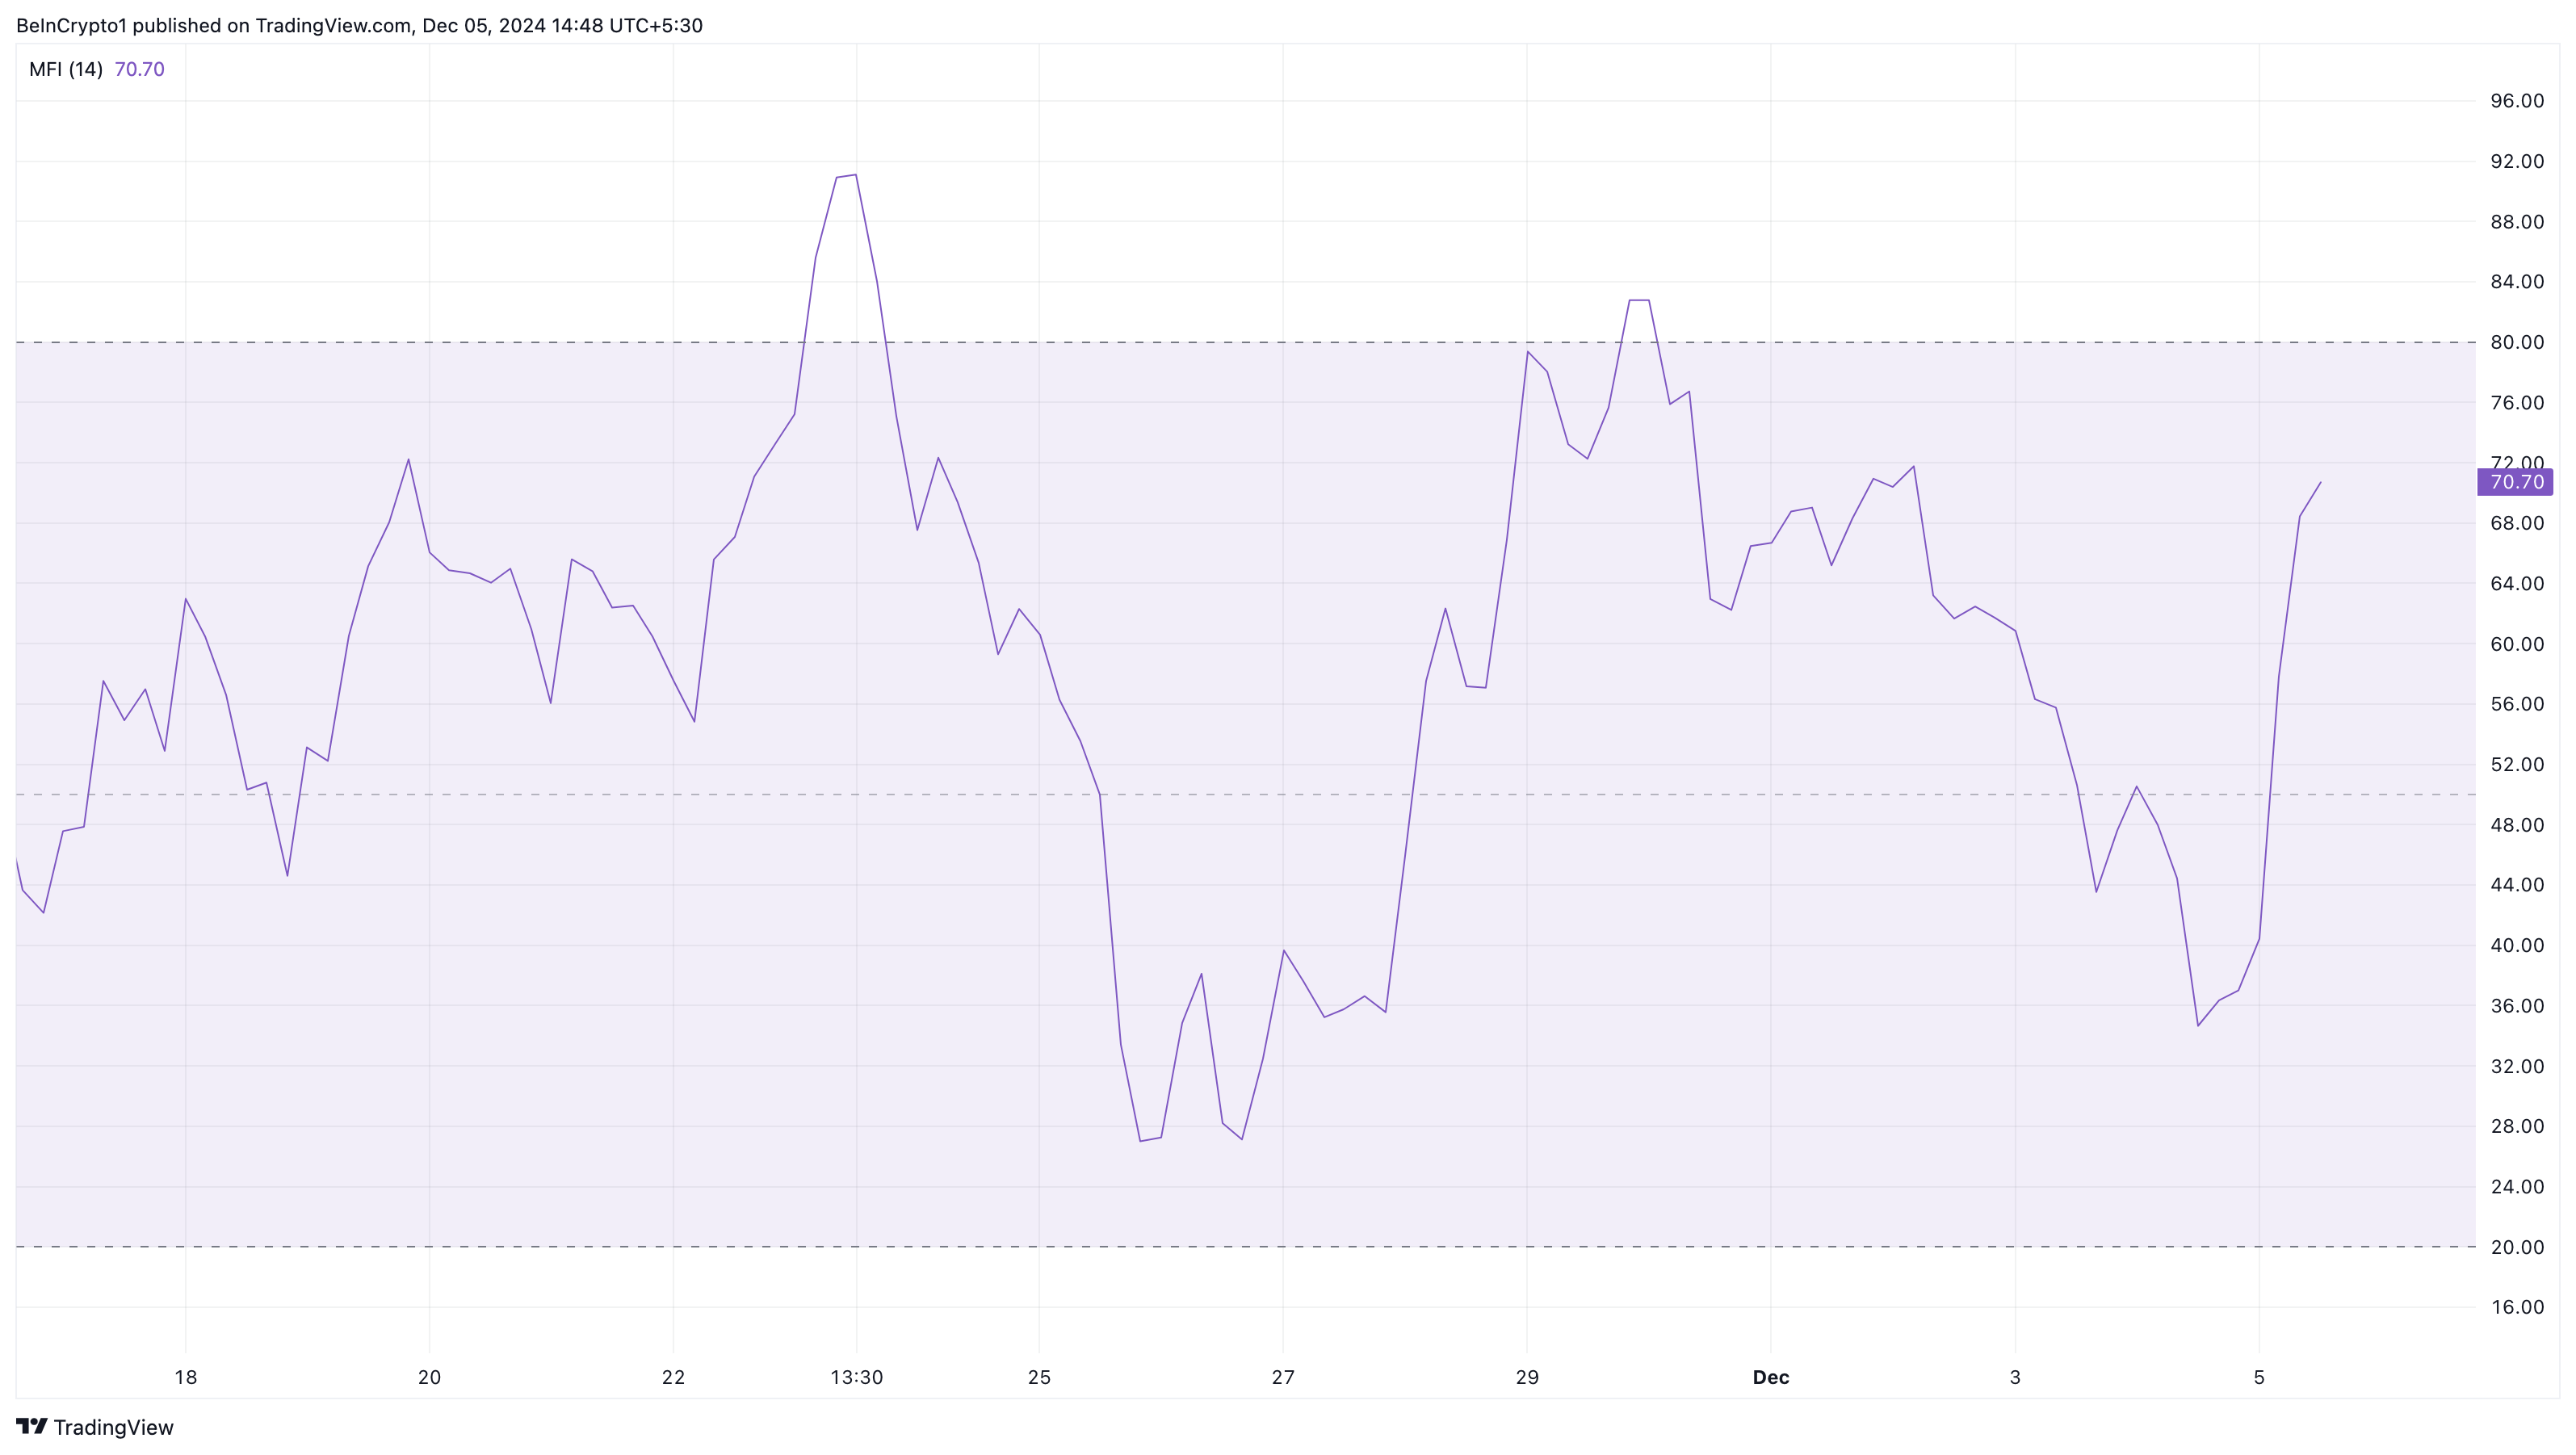 Dogecoin Money Flow Index. Source:
TradingView
Crypto analyst Rekt Capital also supports this bullish outlook, highlighting Dogecoin’s retest of the ascending triangle’s upper boundary on the daily chart. According to the analyst, this technical move indicates that a significant breakout is close.
“Dogecoin has followed every Bitcoin thus far. Now retesting the top of the Ascending Triangle as support.A successful retest here is crucial to precede a confirmed breakout,” Rekt Capital mentioned.
DOGE Price Prediction: Still Bullish
On the daily chart, Dogecoin’s price is trading above the 20-period Exponential Moving Average (EMA) and the 50 EMA. The EMA is a technical indicator that measures the trend around a cryptocurrency.
When the price is above the EMAs, the trend is bullish. On the other hand, if the price is below the trend, the trend is bearish. Therefore, Dogecoin’s price might continue to rise and possibly hit $0.48 in the short term.
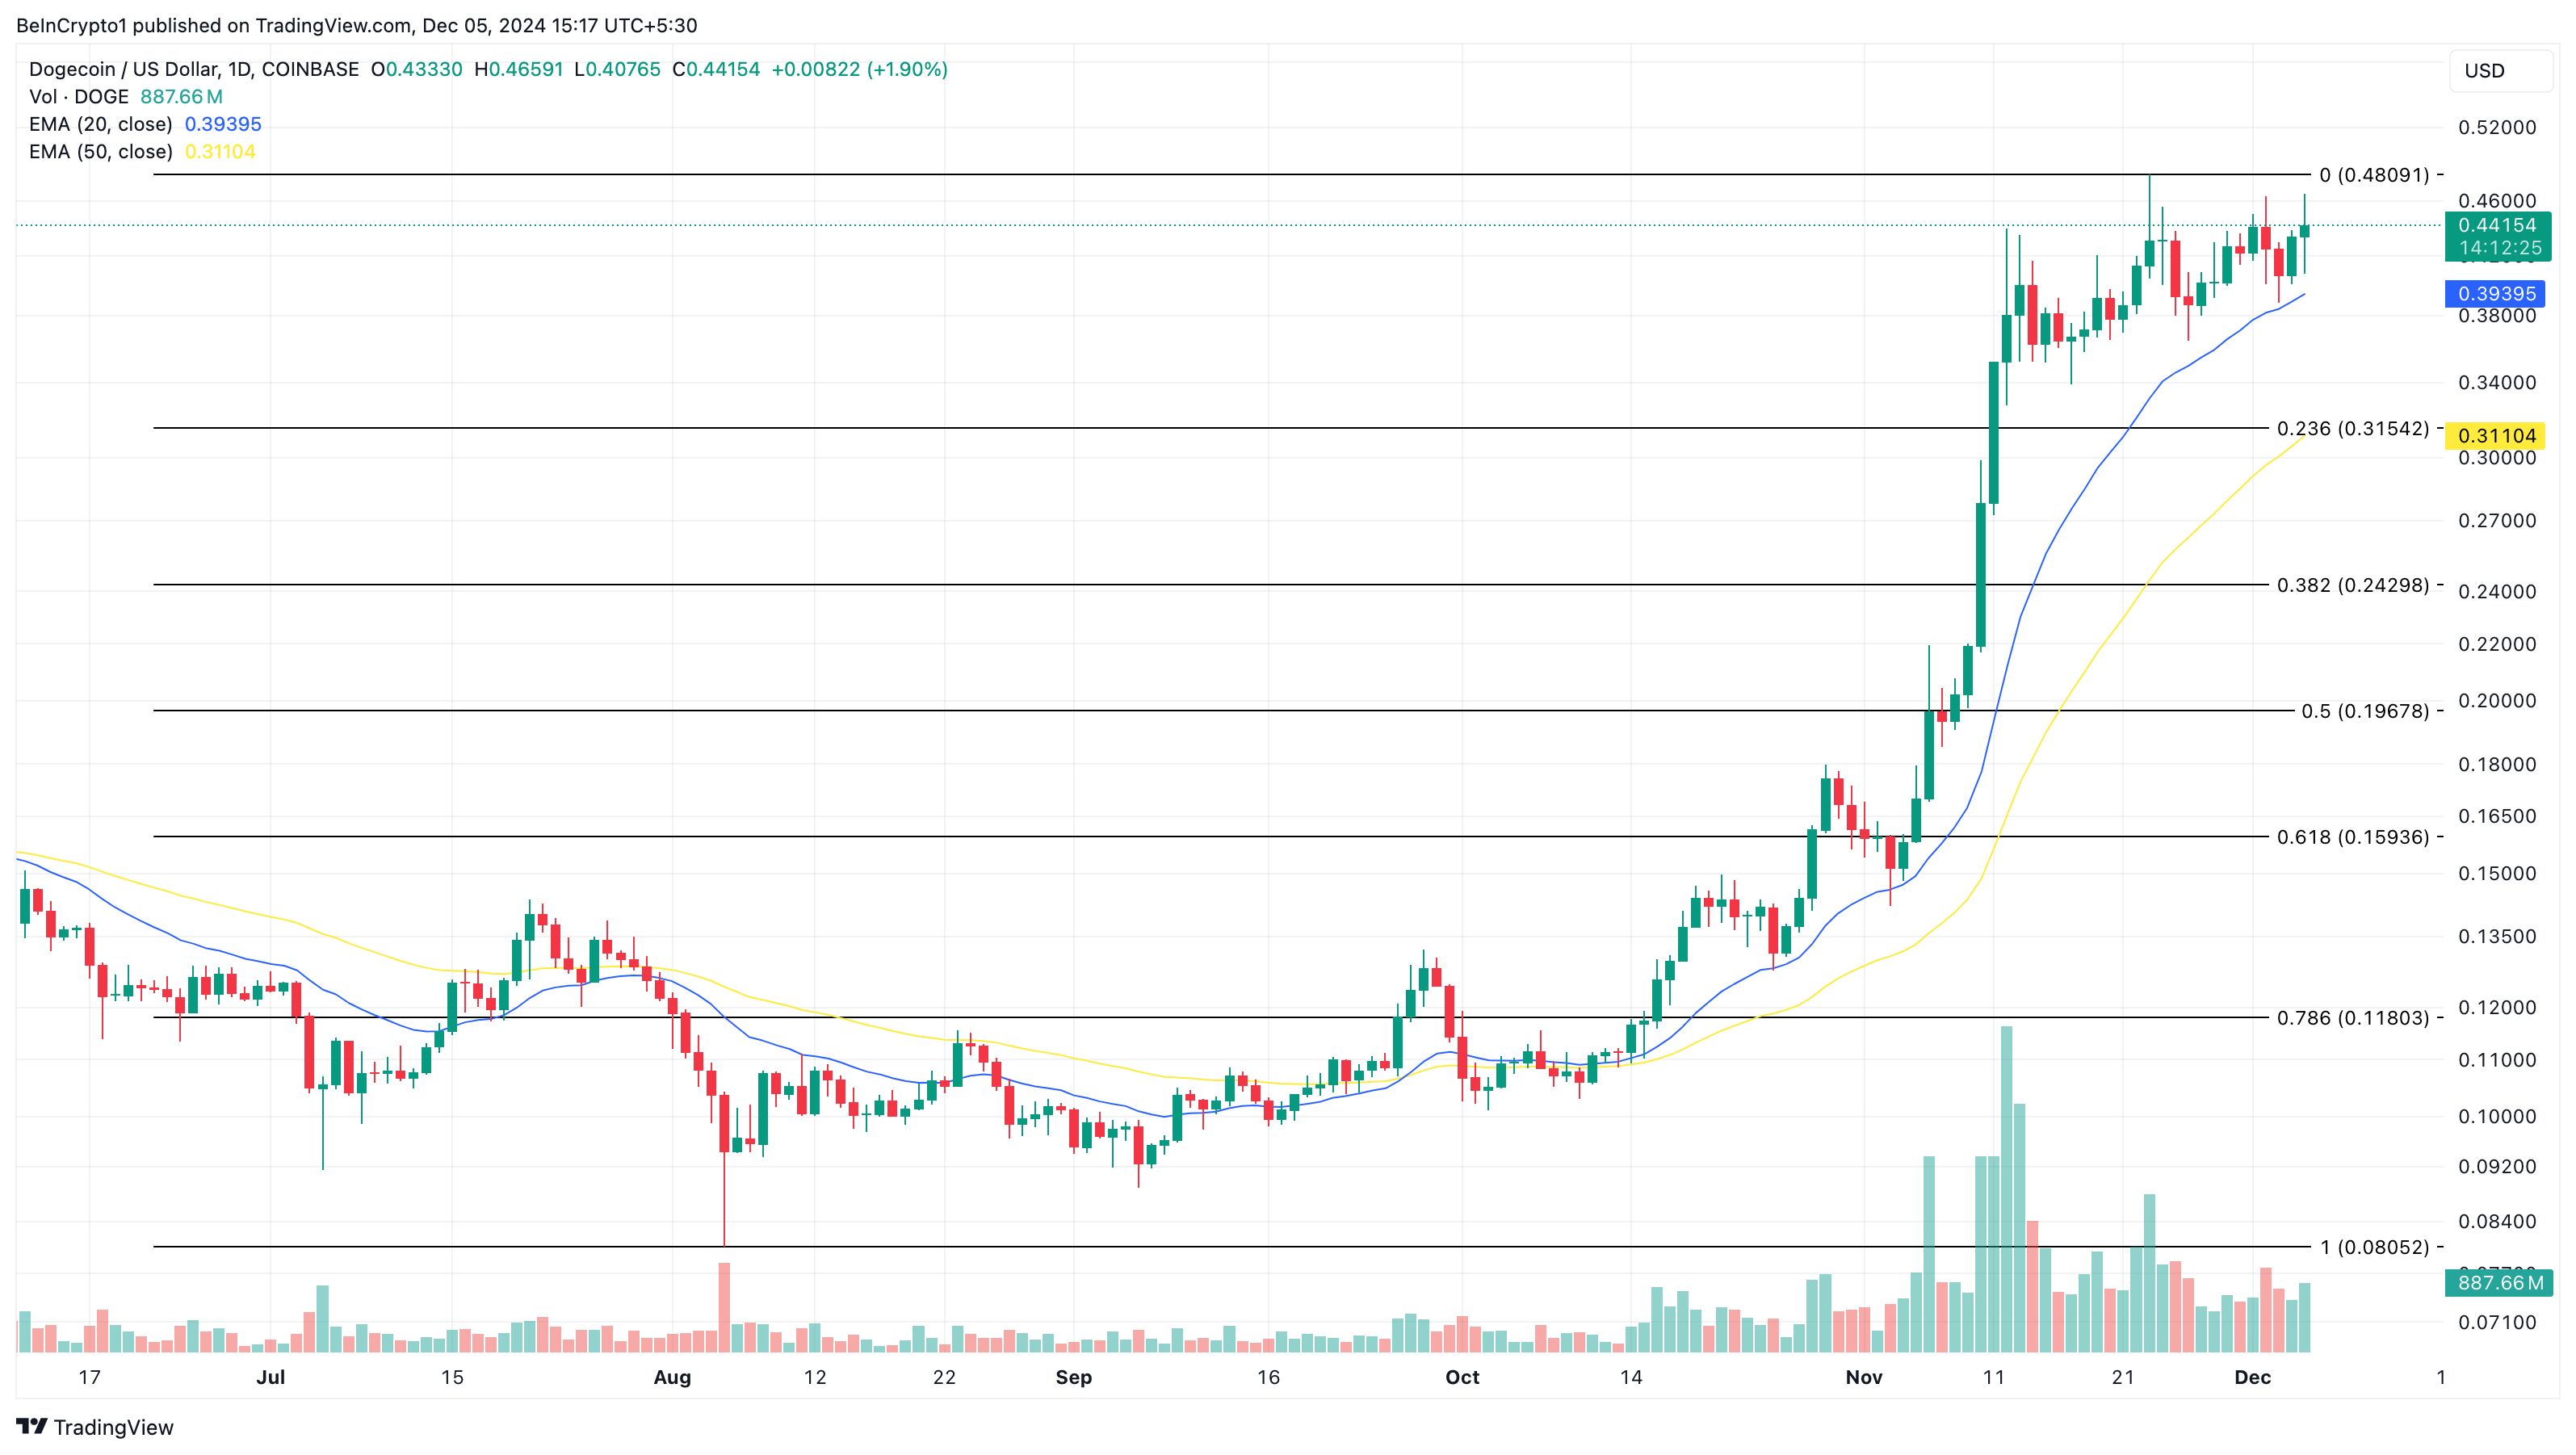 Dogecoin Daily Analysis. Source:
TradingView
If validated, the meme coin’s value might rally to $1 as long the Dogecoin vs Bitcoin chart remains in an uptrend. On the flip side, if DOGE drops against BTC, this might not happen. In that case, the meme coin’s value might decline to $0.32.
Disclaimer: The content of this article solely reflects the author's opinion and does not represent the platform in any capacity. This article is not intended to serve as a reference for making investment decisions.
You may also like
Nasdaq evaporated over $4 trillion in a week! After the global stock market's "Black Friday," the market begins to anticipate an AI industry chain rebound after excessive declines.
The S&P 500 Index plunged by 3.70% on Friday to 6,910.39 points, falling for the seventh consecutive trading day. Alongside the Dow Jones Industrial Average, which dropped 1.93%, both indices pulled back more than 10% from their historic closing highs, confirming entry into a technical correction. The Nasdaq Composite Index fell 5.28%, erasing its gains for the year. The Nasdaq 100 Index dropped 5.61%, falling about 19.84% from its historic closing high on October 6. At one point during the session, the decline exceeded 20%, entering what is referred to as a "technical bear market area."
VIX surges to highest level since the tariff dispute in April last year; Goldman Sachs Fear Index approaches maximum; US stocks may face another $80 billion sell-off next week
As the U.S. stock market faced a sharp sell-off on Friday, two major Wall Street market risk indicators issued warnings simultaneously.
Nvidia (NVDA.US) plunges 46% over seven weeks, marking the longest losing streak since the 2008 financial crisis, with its market capitalization evaporating by $2.6 trillion.
Nvidia is experiencing its longest consecutive weekly decline since the 2008 global financial crisis.
Overnight U.S. Stocks | Stocks, Gold, and Bitcoin Plunge Indiscriminately as VIX Fear Index Surges to 40, Nasdaq Wipes Out Year-to-Date Gains
At the close, the Dow Jones Industrial Average fell 949.73 points, or 1.93%, to 48,147.32 points; the S&P 500 index dropped 265.44 points, or 3.70%, to 6,910.39 points; and the Nasdaq declined 1,261.46 points, or 5.28%, to 22,617.73 points, down 2.7% year-to-date.
Crypto prices
More


