
Ethereum (ETH) Price Regains Footing After $3,000 Scare — What Lies Ahead

Ethereum’s price holds steady at $3,480, backed by a bullish inverse head-and-shoulders pattern and positive on-chain data.
Recently, Ethereum (ETH) showed signs of falling below $3,000 but held firm as bulls defended the altcoin.
Now trading at $3,480, here’s what could be next for ETH.
Ethereum Still Has More Room to Grow
One metric that has consistently proven reliable for analyzing Ethereum is the Market Value to Realized Value (MVRV) ratio, a tool for assessing the profitability of holders and identifying potential market tops or bottoms. The MVRV ratio compares a cryptocurrency’s market value to its realized value, offering insights into whether the asset is overvalued or undervalued.
When the MVRV ratio rises, it indicates that more holders are in profit. However, if it climbs to an extreme high, it suggests the asset may be overvalued, increasing the risk of a price correction. Conversely, when the MVRV ratio declines, it points to reduced profitability.
If the ratio hits an extreme low, it signals undervaluation, which can present an attractive accumulation opportunity for investors. For ETH, the 30-day MVRV ratio has risen to 11.89%. However, this ratio is not close to the local top, which is usually around 18% and 22%. Therefore, this development suggests that Ethereum’s price.
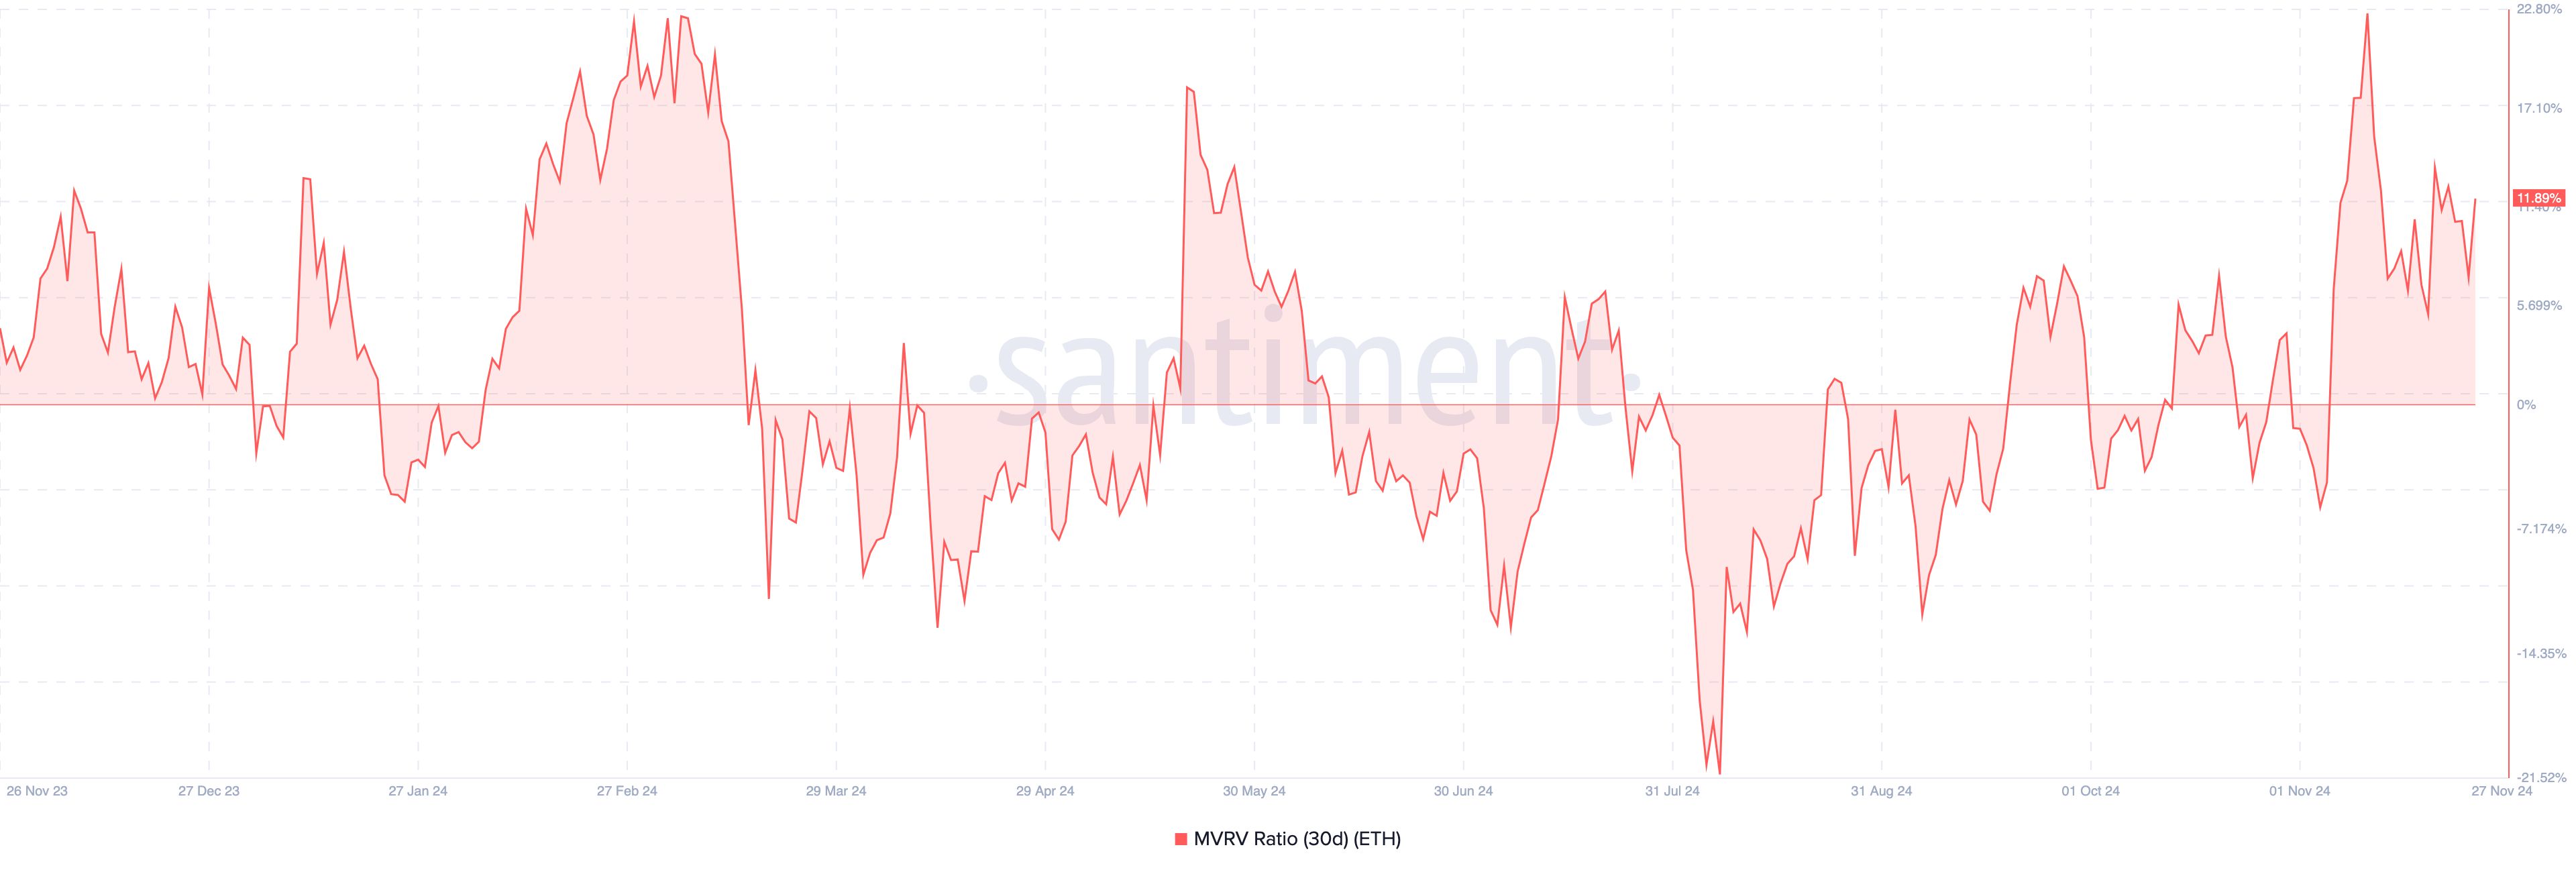 Ethereum 30-Day MVRV Ratio. Source:
Santiment
Beyond the MVRV ratio, the Mean Dollar Invested Age (MDIA) also suggests that Ethereum may avoid a further price drop. MDIA measures the average age of all coins on a blockchain, weighted by their purchase price.
A rising MDIA indicates that coins are becoming more stagnant, reducing the likelihood of a significant price surge.
Conversely, a declining MDIA suggests that previously dormant coins are moving, signaling increased trading activity, which is the case with ETH. If this trend persists, it could boost Ethereum’s chances of a price rally.
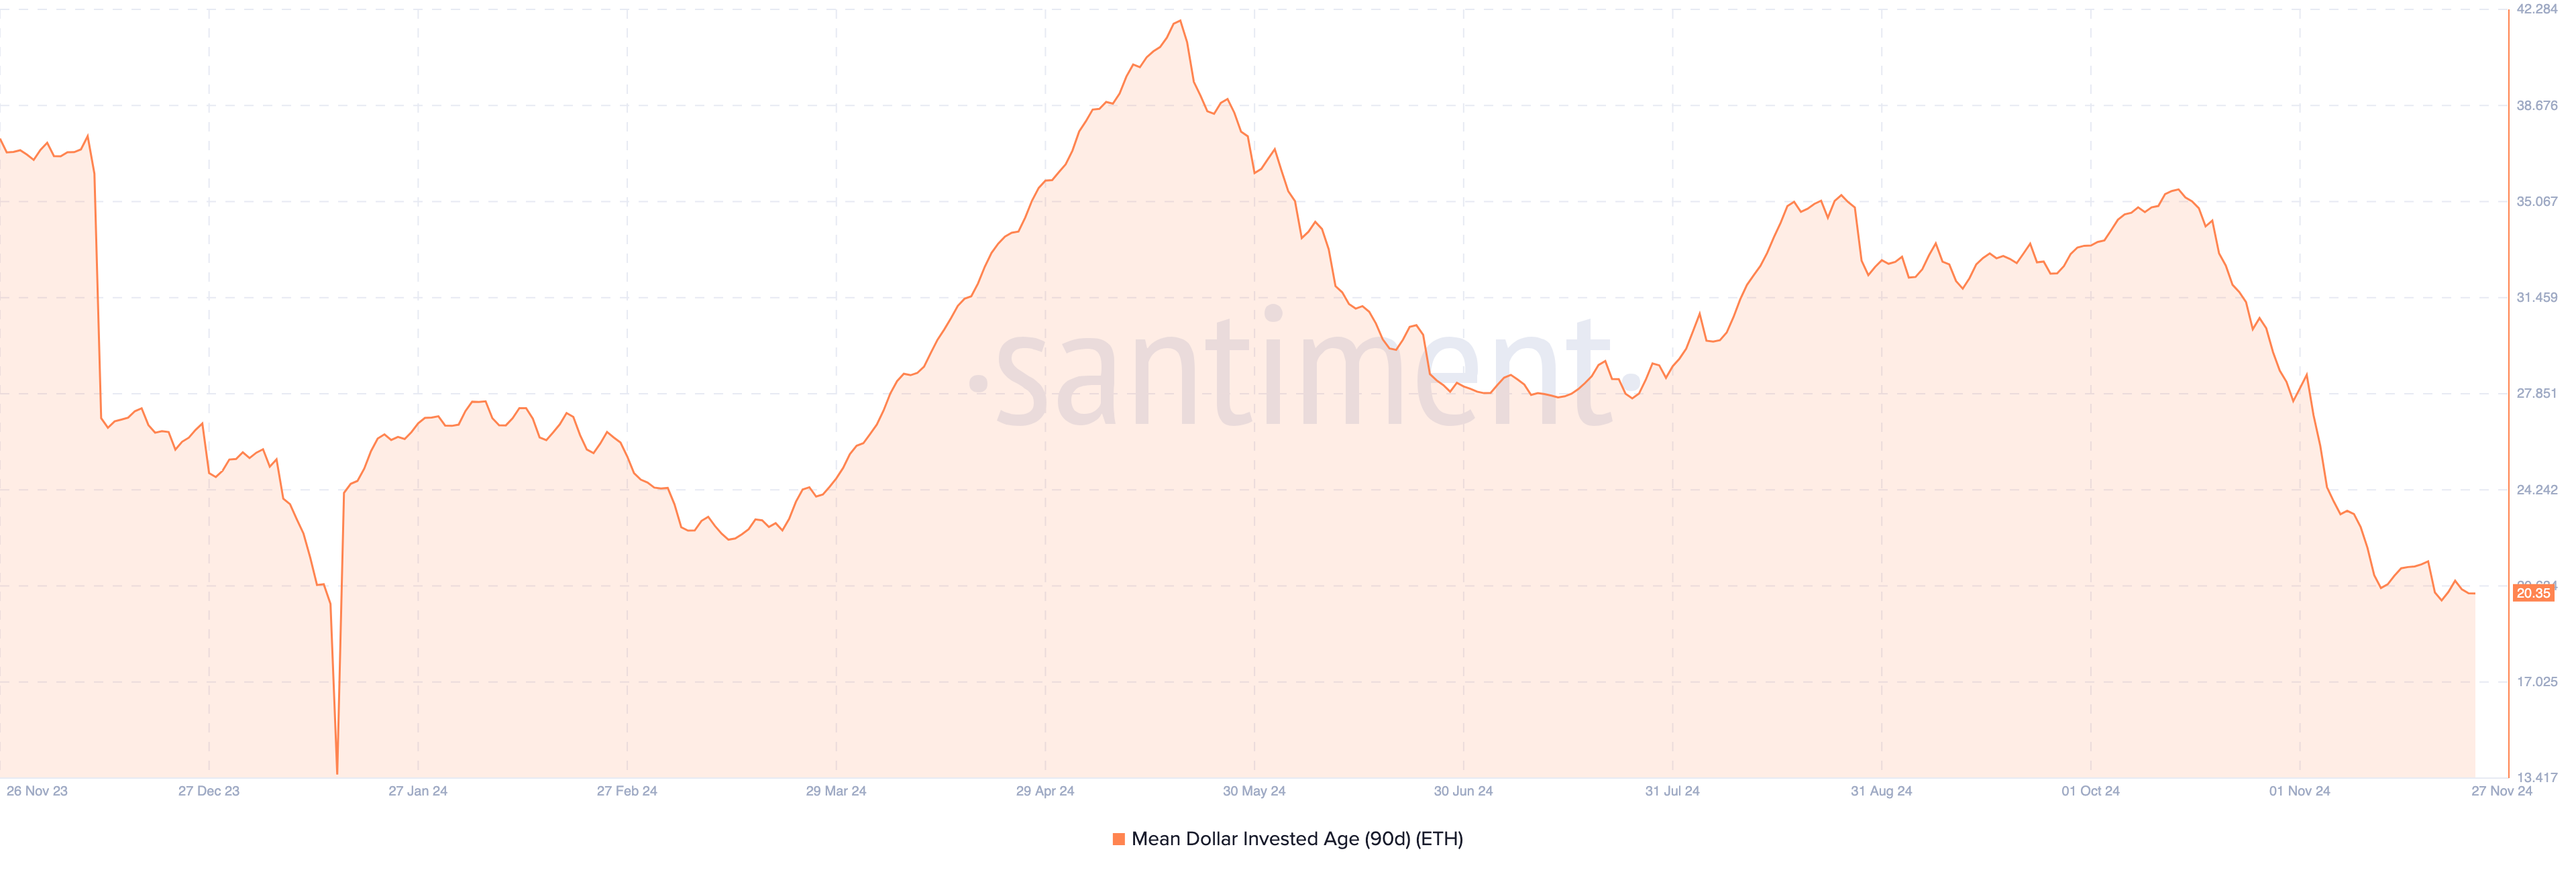 Ethereum 90-Day MDIA. Source:
Santiment
ETH Price Prediction: $4,000 Could Be Coming
On the daily chart, Ethereum’s price has formed an inverse head-and-shoulders pattern. This pattern typically emerges after a prolonged downtrend, signaling a potential sellers’ exhaustion point.
The pattern comprises three key parts: the left shoulder, which marks the first uptrend; the head, signaling the end of the downtrend; and the right shoulder, indicating the rebound.
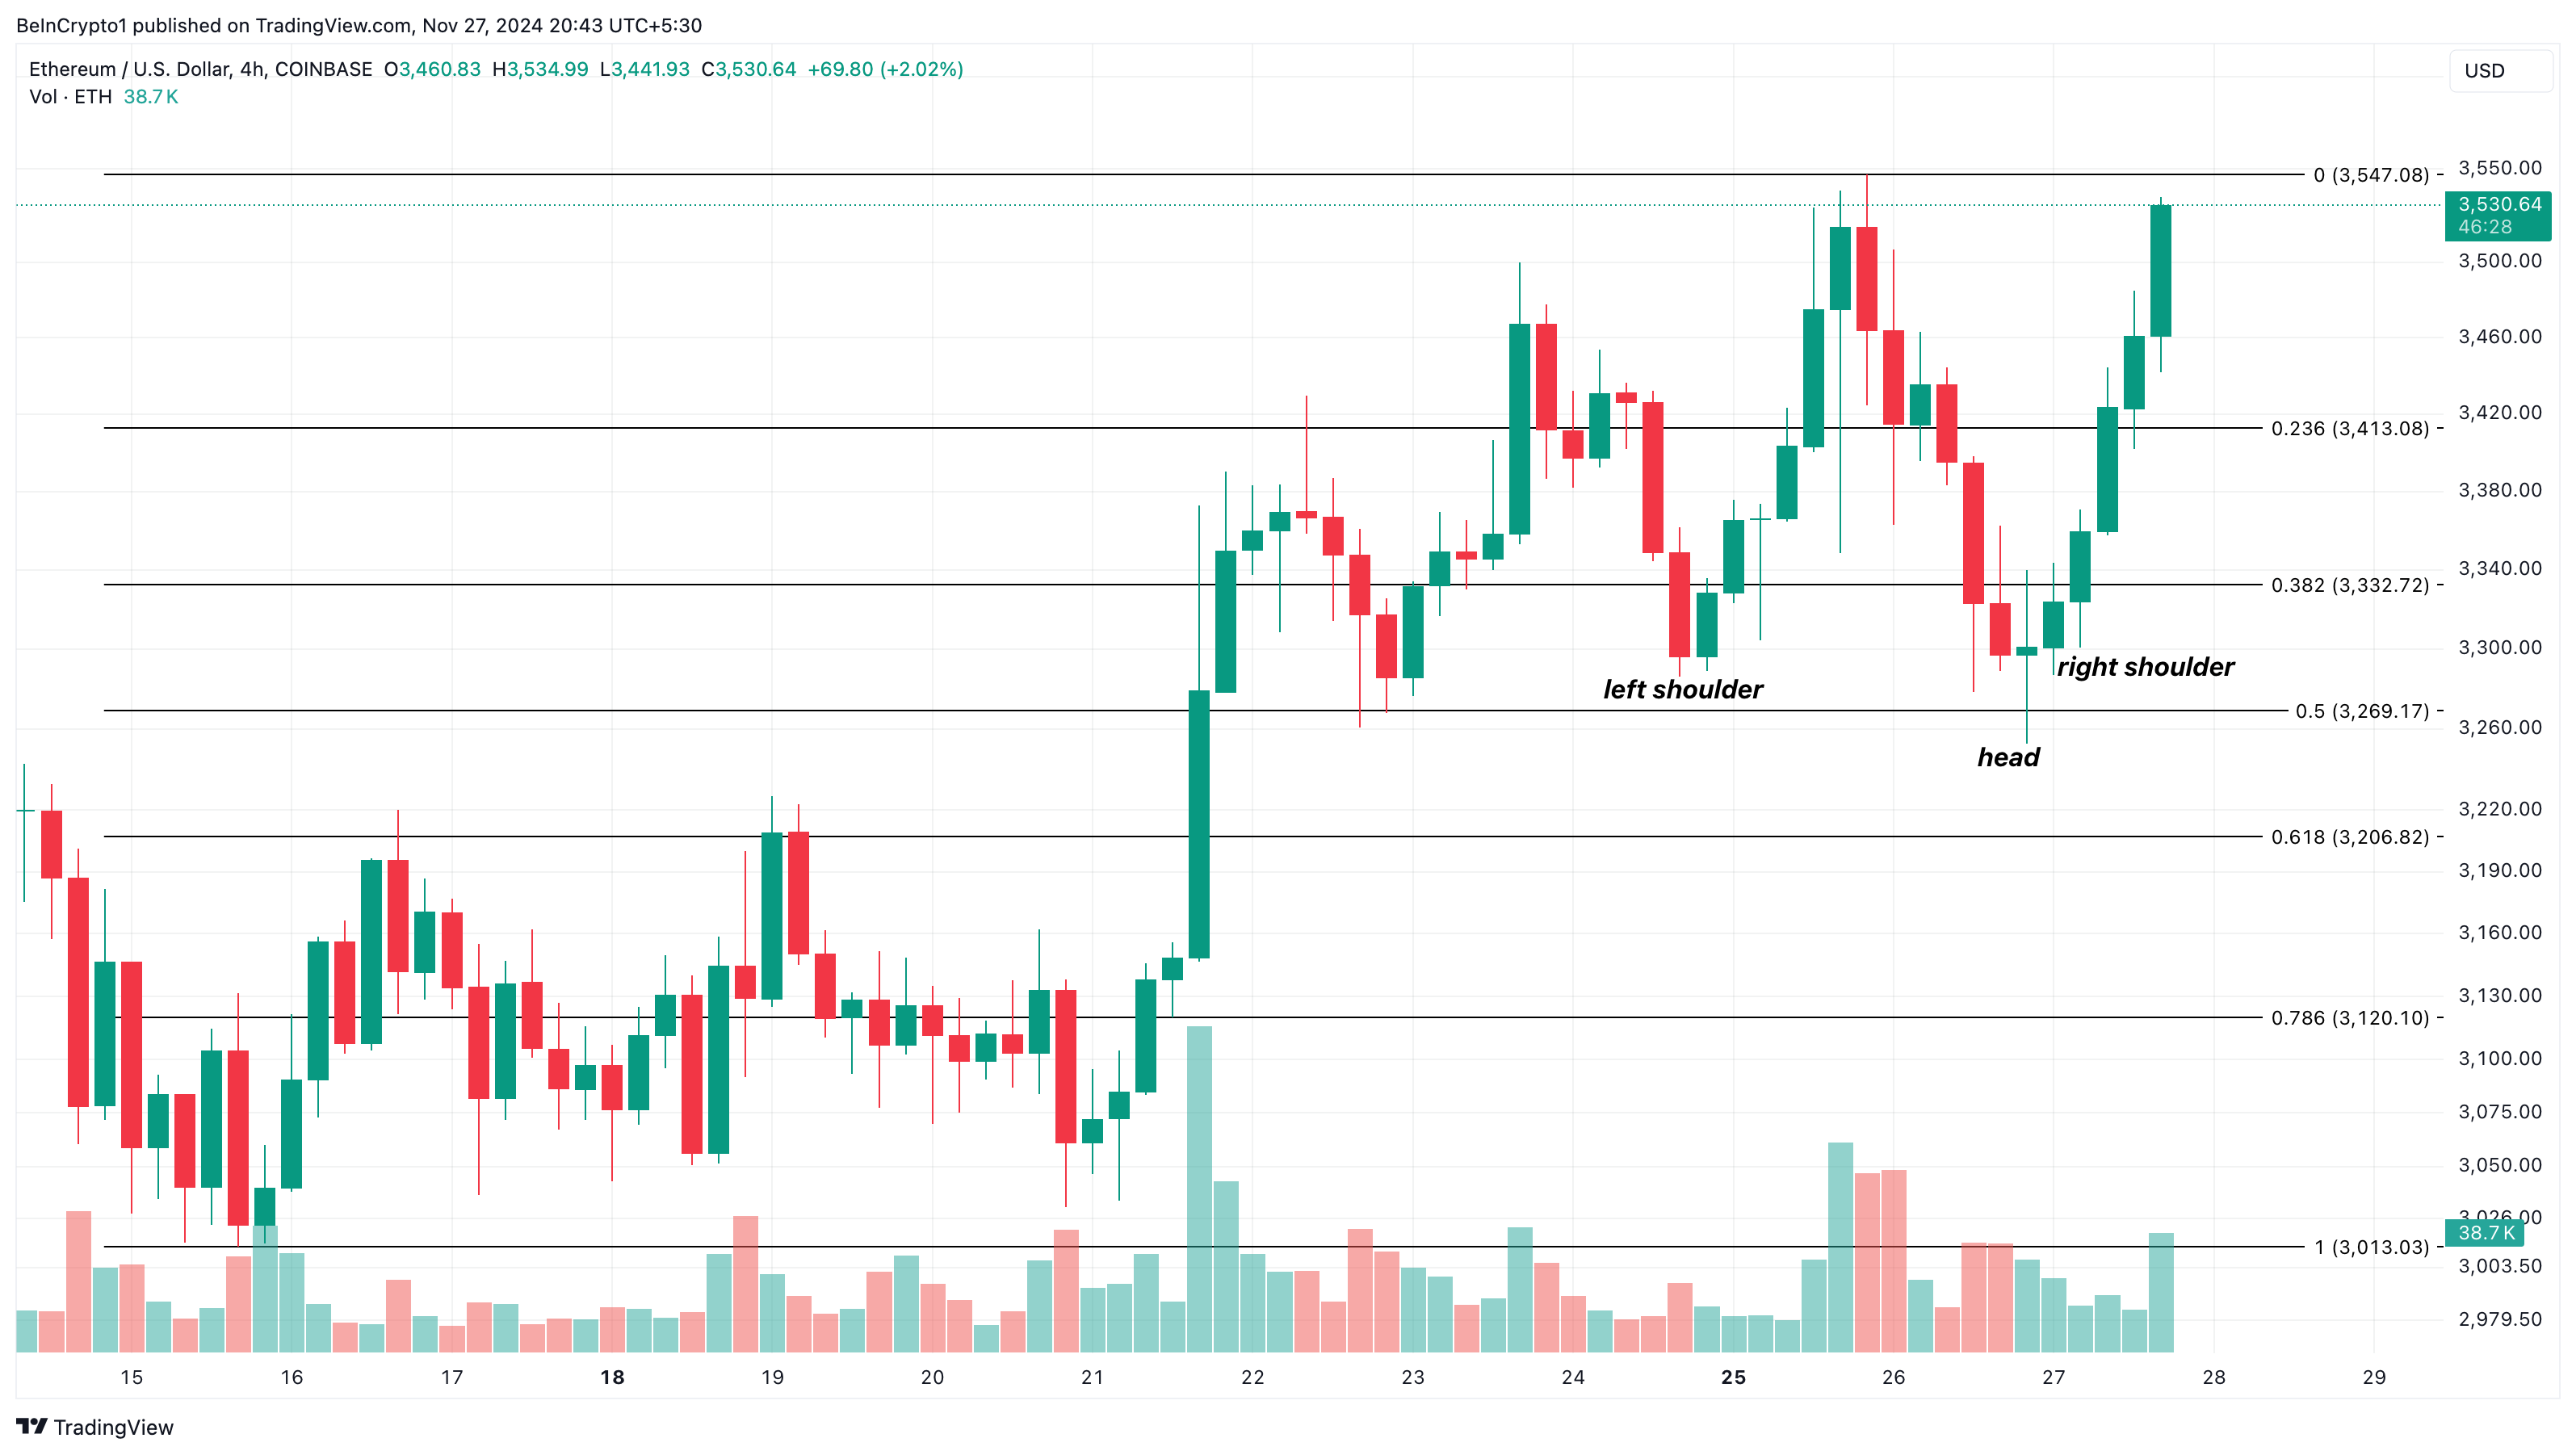 Ethereum 4-Hour Analysis. Source:
TradingView
With ETH trending in an uptrend, the cryptocurrency is likely to rise toward $4,000 in the short term. On the other hand, if selling pressure rises, this might change, and ETH could decline to $3,206.
Disclaimer: The content of this article solely reflects the author's opinion and does not represent the platform in any capacity. This article is not intended to serve as a reference for making investment decisions.
You may also like
Wall Street technology veteran Niles is optimistic that Anthropic (ANT.US) will win the AI agent price war, but warns that its stock price may fall below the offering price.
Anthropic's IPO exceeded expectations, but Dan Niles warns of valuation risks, slowing growth in AI revenue, and price competition.
After Jensen Huang's resignation, Nvidia faces a new threat: losing its top engineers
Thousands of Nvidia employees have petitioned for Jensen Huang to return to his position, with some publicly criticizing the board's decision; some employees have already announced their resignation. Interim CEO Kress has issued early salary increases and stock rewards in an effort to stabilize the team, but AMD, Broadcom, and AI startups are poised to poach talent. Analysts warn that if five to ten key technology leaders leave, it could affect decisions on chip and software architecture, product iteration, and the planning of next-generation AI technologies.

Singapore and German Central Banks Successfully Test Cross-Border CBDC Settlements

Gen Z Turns to Crypto for Wealth Building as SoFi Reveals New Trends
Crypto prices
More


